Technical Analysis $INIT /USDT Perpetual (1D)
Structure & Trend: Chart Technical Analysis INIT/USDT Perpetual (1D)
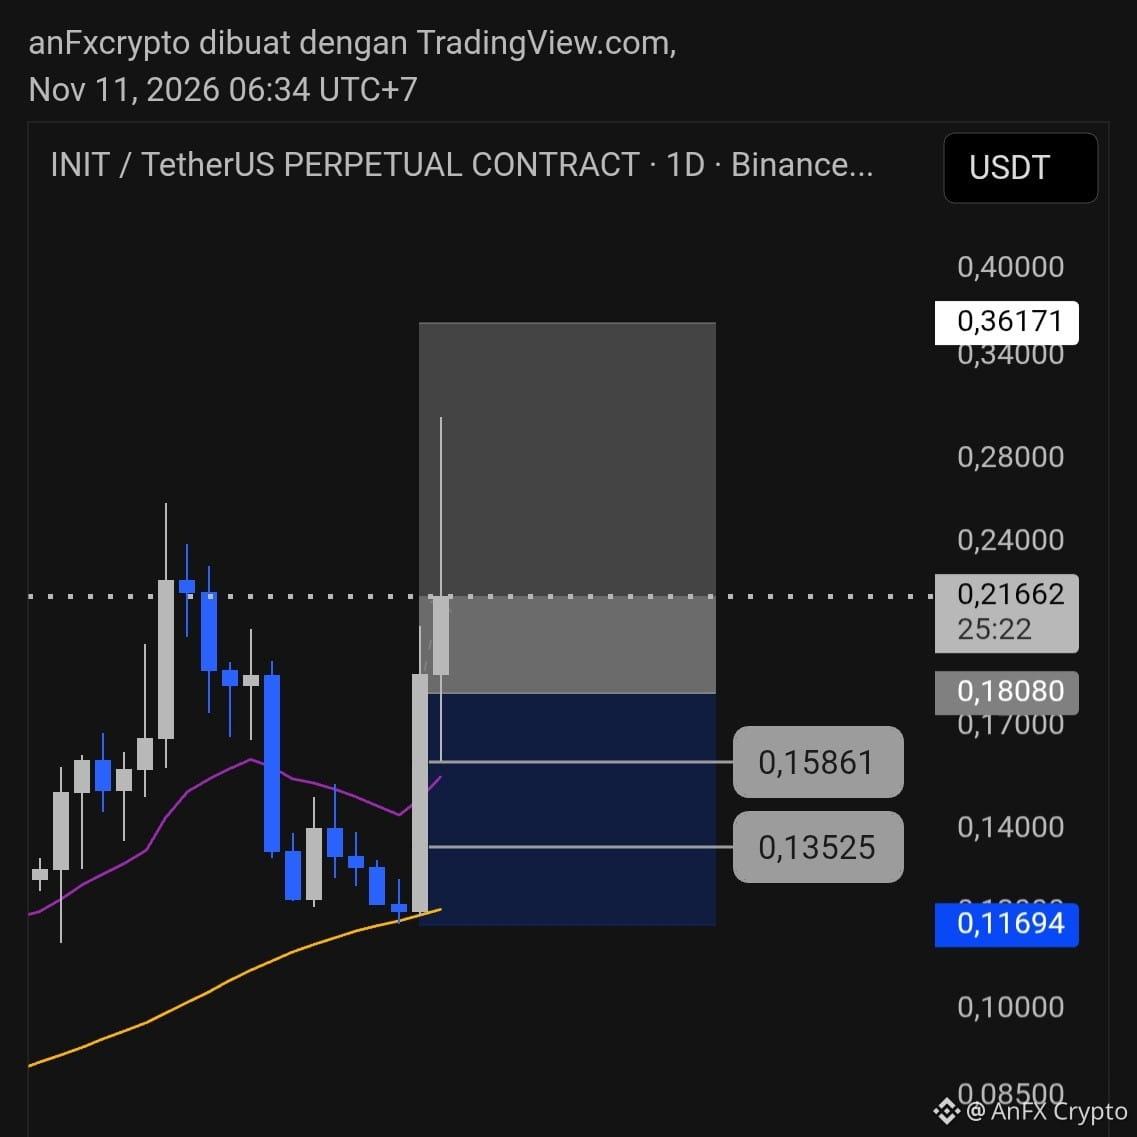
Structure & Trend: The daily chart shows a strong, impulsive vertical surge (massive breakout) out of the previous consolidation range, breaking through important resistance. Daily trading volume surged dramatically, indicating an aggressive influx of institutional/speculative liquidity.
Key Price Zones:
Resistance/Target: Around $0,2166 up to the psychological zone at $0,3617.
Support/Order Block Area: $0,1352 – $0,1586.
Trading Signal (Futures / Perpetual)
Signal Direction: LONG (Buy on Dip) / Breakout Continuation
Entry Area (Buy Zone): $0,1586 – $0,1808 (Wait for a healthy pullback after the parabolic surge)
Take Profit (TP):
TP1: $0,2166
TP2: $0,2800
TP3: $0,3617
Stop Loss (SL): Below $0,1350 (Strict risk management given the high volatility caused by a short squeeze / derivatives speculation)
The daily chart shows a strong, impulsive vertical surge (massive breakout) out of the previous consolidation range, breaking through important resistance. Daily trading volume surged dramatically, indicating an aggressive influx of institutional/speculative liquidity.
Key Price Zones:
Resistance/Target: Around $0,2166 up to the psychological zone at $0,3617.
Support/Order Block Area: $0,1352 – $0,1586.
Trading Signal (Futures / Perpetual)
Signal Direction: LONG (Buy on Dip) / Breakout Continuation
Entry Area (Buy Zone): $0,1586 – $0,1808 (Wait for a healthy pullback after the parabolic surge)
Take Profit (TP):
TP1: $0,2166
TP2: $0,2800
TP3: $0,3617
Stop Loss (SL): Below $0,1350 (Strict risk management given the high volatility caused by a short squeeze / derivatives speculation)
Structure & Trend: Chart Technical Analysis INIT/USDT Perpetual (1D)
Structure & Trend: The daily chart shows a strong, impulsive vertical surge (massive breakout) out of the previous consolidation range, breaking through important resistance. Daily trading volume surged dramatically, indicating an aggressive influx of institutional/speculative liquidity.
Key Price Zones:
Resistance/Target: Around $0,2166 up to the psychological zone at $0,3617.
Support/Order Block Area: $0,1352 – $0,1586.
Trading Signal (Futures / Perpetual)
Signal Direction: LONG (Buy on Dip) / Breakout Continuation
Entry Area (Buy Zone): $0,1586 – $0,1808 (Wait for a healthy pullback after the parabolic surge)
Take Profit (TP):
TP1: $0,2166
TP2: $0,2800
TP3: $0,3617
Stop Loss (SL): Below $0,1350 (Strict risk management given the high volatility caused by a short squeeze / derivatives speculation)
The daily chart shows a strong, impulsive vertical surge (massive breakout) out of the previous consolidation range, breaking through important resistance. Daily trading volume surged dramatically, indicating an aggressive influx of institutional/speculative liquidity.
Key Price Zones:
Resistance/Target: Around $0,2166 up to the psychological zone at $0,3617.
Support/Order Block Area: $0,1352 – $0,1586.
Trading Signal (Futures / Perpetual)
Signal Direction: LONG (Buy on Dip) / Breakout Continuation
Entry Area (Buy Zone): $0,1586 – $0,1808 (Wait for a healthy pullback after the parabolic surge)
Take Profit (TP):
TP1: $0,2166
TP2: $0,2800
TP3: $0,3617
Stop Loss (SL): Below $0,1350 (Strict risk management given the high volatility caused by a short squeeze / derivatives speculation)