$XDP XDP/USDT
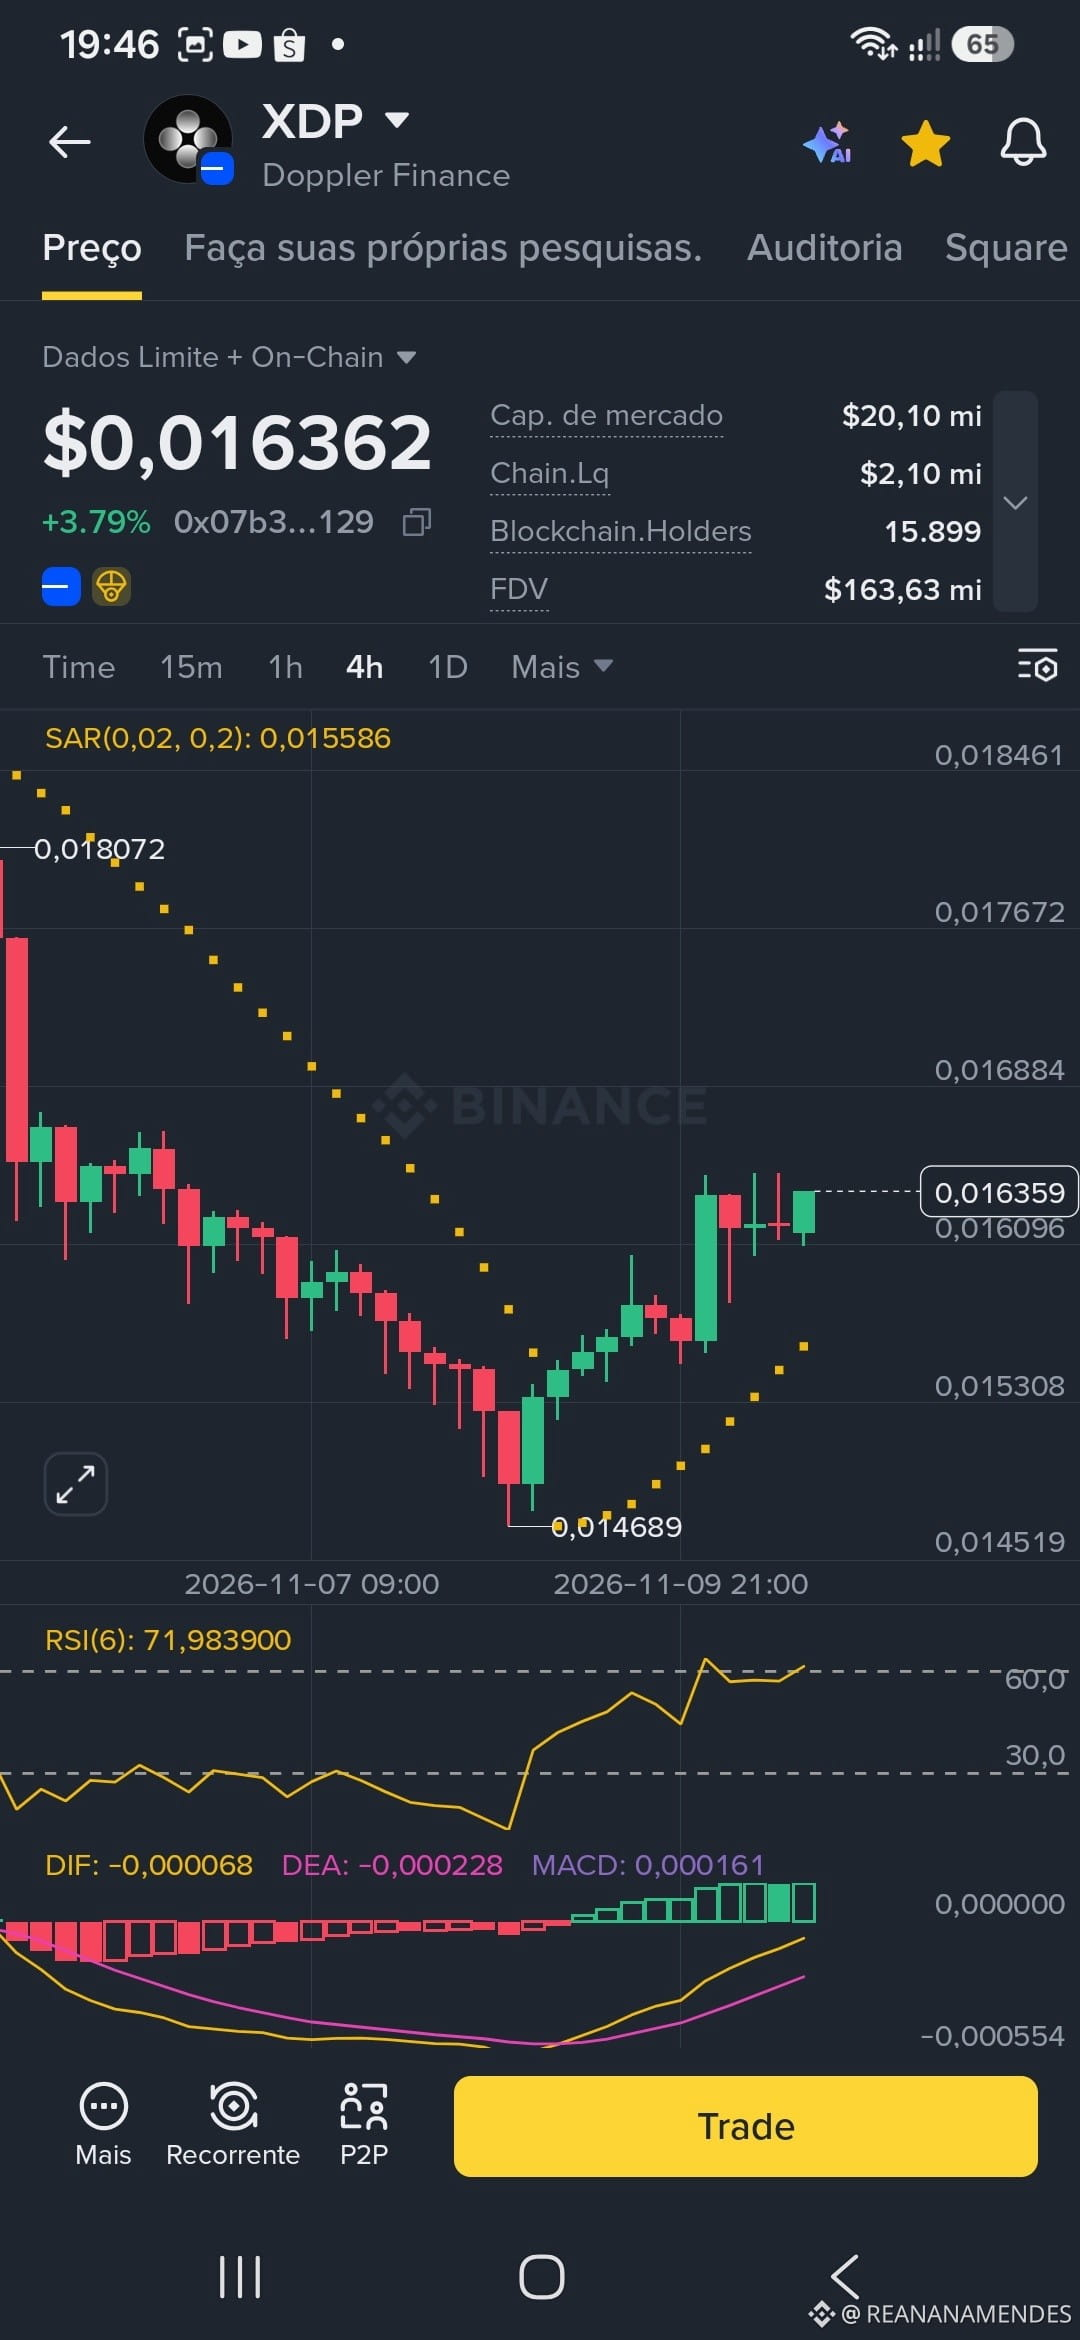
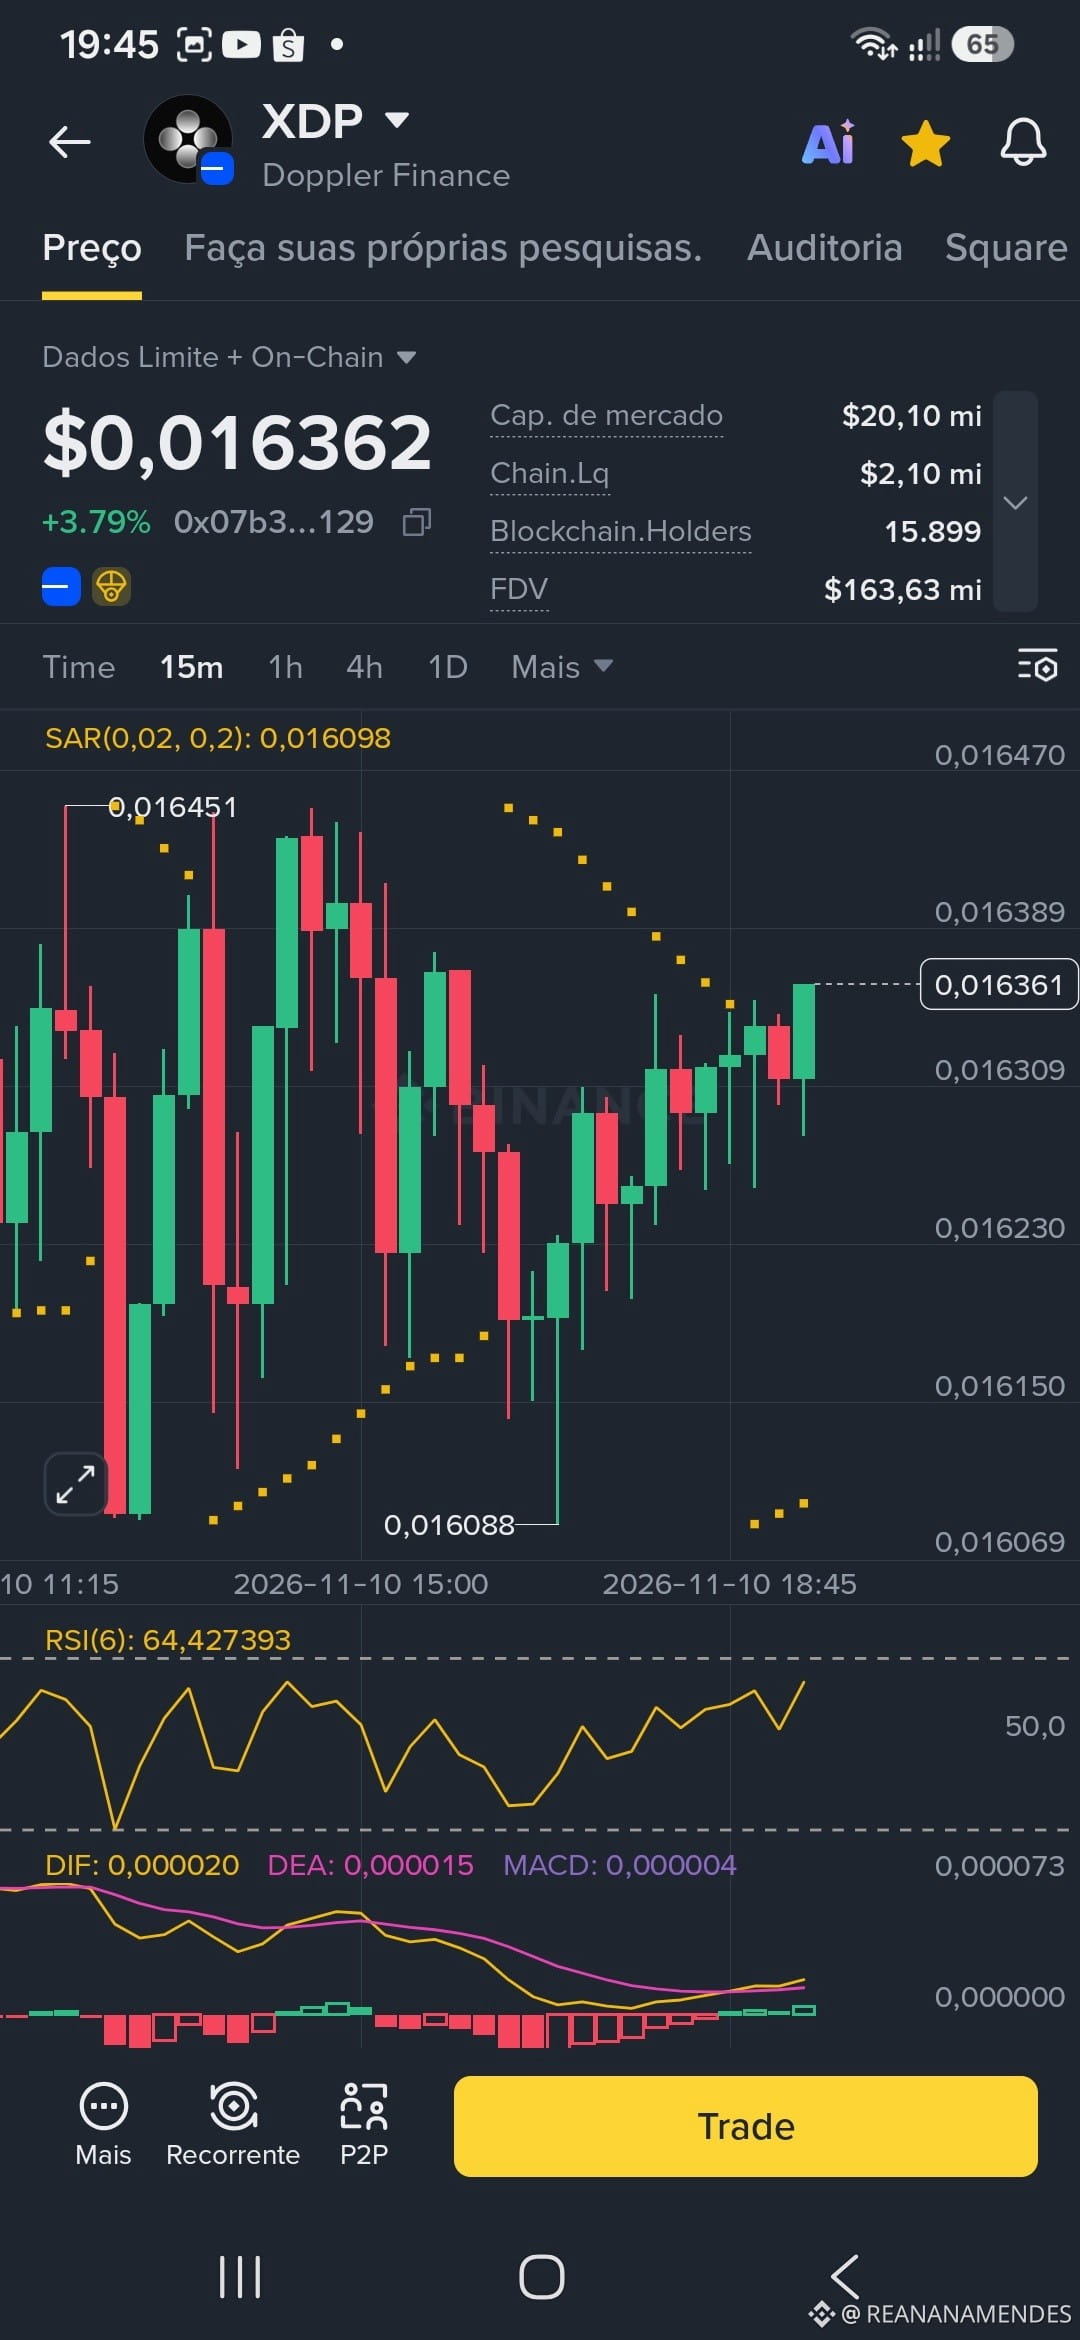
Technical Analysis: After bottoming at $0.0146 (4h) and $0.0160 (15m), XDP began a consistent upward move. The RSI is in the 64–71 range, showing active buying momentum, while the MACD displays consistent green bars. The price is testing local resistance levels, with the Parabolic SAR acting as dynamic support at the base of the move.
🔥 XDP/USDT: Bullish Momentum with Favorable Indicators!
Interesting move in XDP! The token held firm in the $0.0146 support region and has been forming a pattern of higher highs and higher lows on shorter timeframes. The MACD remains bullish, and the RSI in the 64–71 range reflects buying interest.
Technical Analysis: After bottoming at $0.0146 (4h) and $0.0160 (15m), XDP began a consistent upward move. The RSI is in the 64–71 range, showing active buying momentum, while the MACD displays consistent green bars. The price is testing local resistance levels, with the Parabolic SAR acting as dynamic support at the base of the move.
🔥 XDP/USDT: Bullish Momentum with Favorable Indicators!
Interesting move in XDP! The token held firm in the $0.0146 support region and has been forming a pattern of higher highs and higher lows on shorter timeframes. The MACD remains bullish, and the RSI in the 64–71 range reflects buying interest.