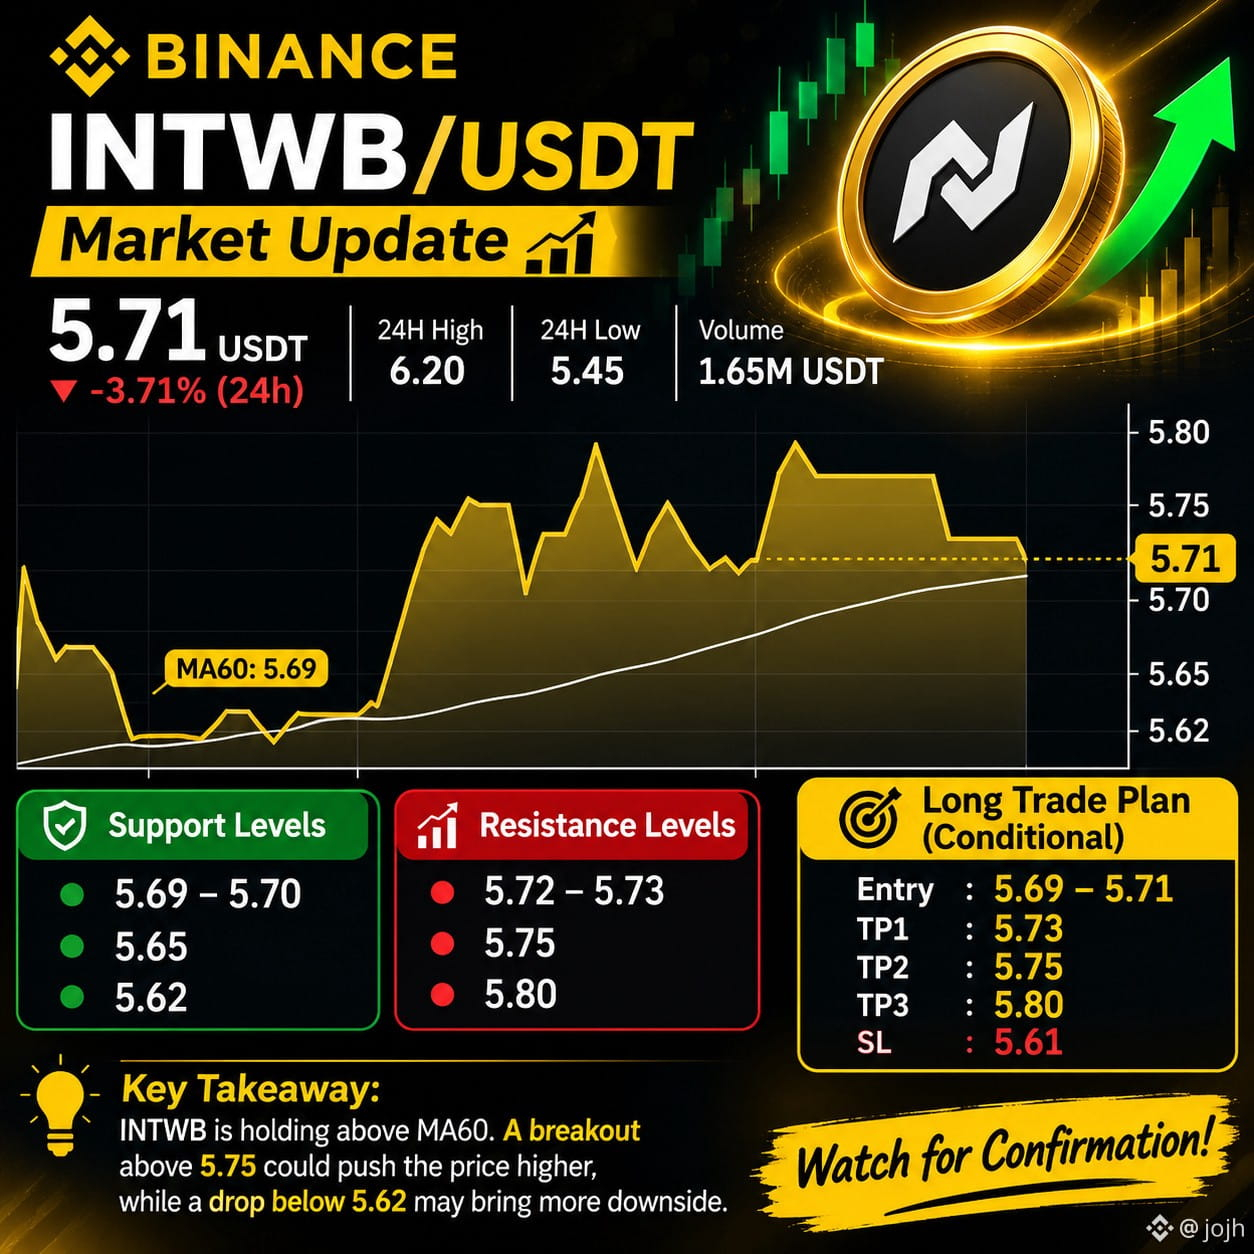
$INTWB is trading around 5.71 USDT, down 3.71% over the last 24 hours.
The 15-minute chart shows a recovery from the 5.63–5.65 area, with price currently holding slightly above MA60 at 5.69.
However, buyers still need to break the nearby resistance zone to confirm stronger momentum.
🔹 Current Price: 5.71 USDT
🔹 24H High: 6.20 USDT
🔹 24H Low: 5.45 USDT
🔹 MA60: 5.69 USDT
🎯 Technical Levels
🟢 Support: • 5.69 – 5.70
• 5.65
• 5.62
🔴 Resistance: • 5.72 – 5.73
• 5.75
• 5.80
📈 Potential Long Setup (Conditional)
Entry: 5.69 – 5.71, only if support holds and bullish confirmation appears.
TP1: 5.73
TP2: 5.75
TP3: 5.80
Stop Loss: 5.61
⚠️ Important: These are speculative levels based on the visible chart, not confirmed trading signals. A breakdown below 5.62 could invalidate the recovery setup. A breakout above 5.75 with stronger volume would improve the bullish outlook.
What do you think? 👇
Will INTWB break above 5.75, or will sellers push it back toward 5.65?
Share your thoughts in the comments!
#INTWB #INTWBUSDT #CryptoTrading #BinanceSquare #TechnicalAnalysis
The 15-minute chart shows a recovery from the 5.63–5.65 area, with price currently holding slightly above MA60 at 5.69.
However, buyers still need to break the nearby resistance zone to confirm stronger momentum.
🔹 Current Price: 5.71 USDT
🔹 24H High: 6.20 USDT
🔹 24H Low: 5.45 USDT
🔹 MA60: 5.69 USDT
🎯 Technical Levels
🟢 Support: • 5.69 – 5.70
• 5.65
• 5.62
🔴 Resistance: • 5.72 – 5.73
• 5.75
• 5.80
📈 Potential Long Setup (Conditional)
Entry: 5.69 – 5.71, only if support holds and bullish confirmation appears.
TP1: 5.73
TP2: 5.75
TP3: 5.80
Stop Loss: 5.61
⚠️ Important: These are speculative levels based on the visible chart, not confirmed trading signals. A breakdown below 5.62 could invalidate the recovery setup. A breakout above 5.75 with stronger volume would improve the bullish outlook.
What do you think? 👇
Will INTWB break above 5.75, or will sellers push it back toward 5.65?
Share your thoughts in the comments!
#INTWB #INTWBUSDT #CryptoTrading #BinanceSquare #TechnicalAnalysis