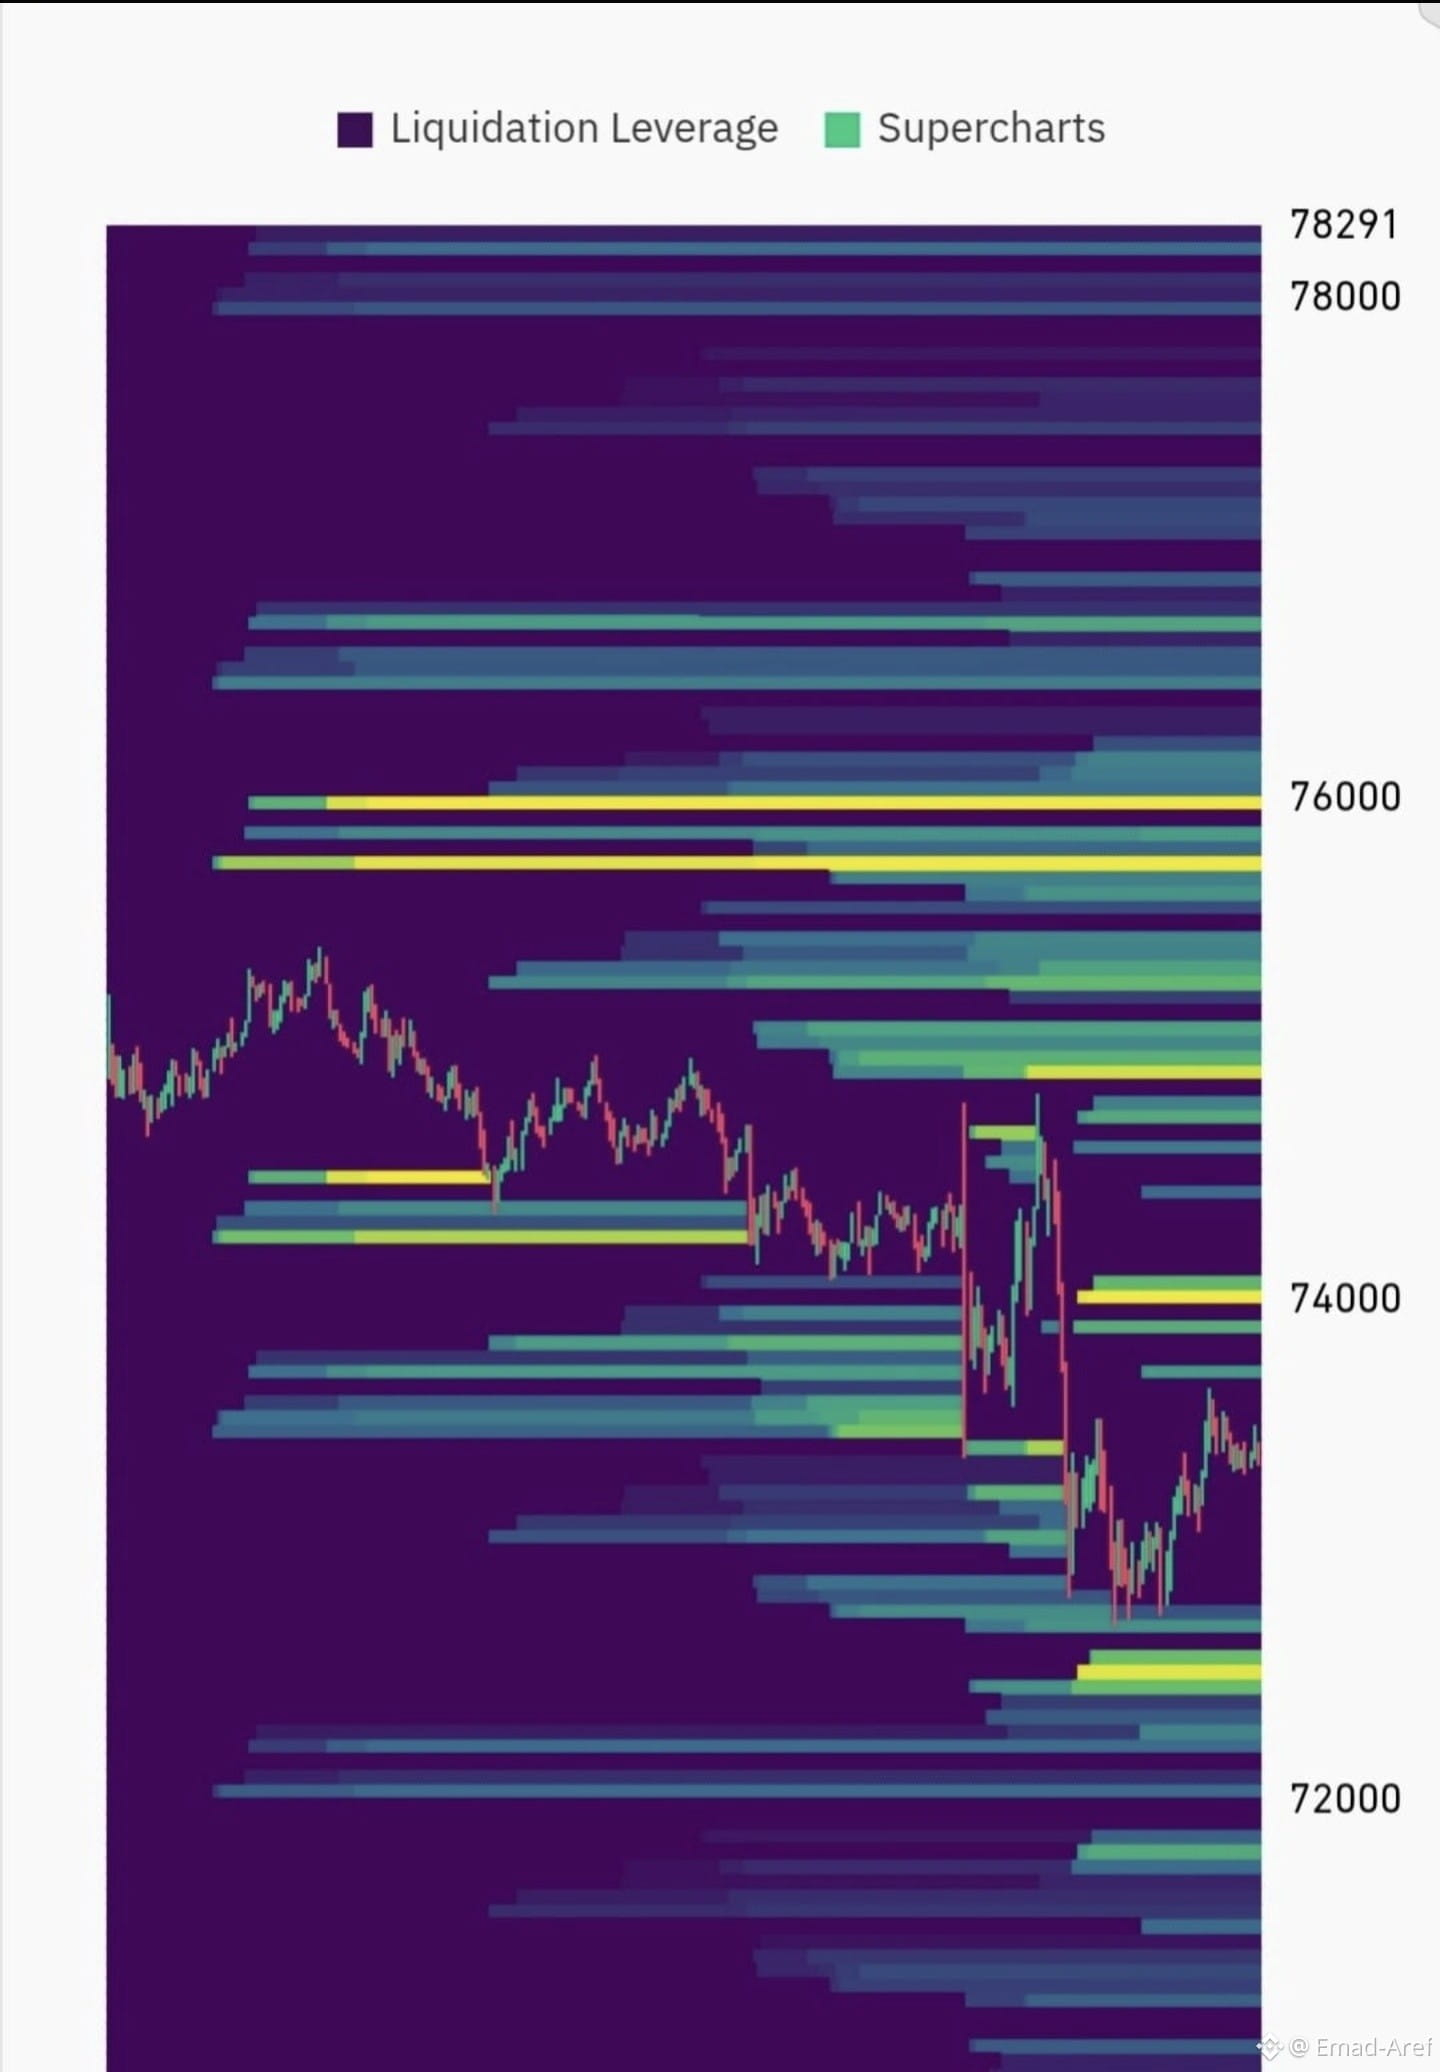
🚨 Liquidation heatmap for $BTC .. Where are the traps and upcoming opportunities? 📉📈
Guys, focus with me as we read the liquidation heatmap for $BTC ;
Bitcoin has eaten up and swallowed nearby liquidity around $72,700–$73,000, but the chart is still packed with huge liquidity clusters above and below, waiting to be targeted!
📊 Reading the heatmap by the numbers (where is liquidity concentrated?):
》 Upside liquidity (above):
- Nearest stop: $74,000
- The largest cluster and major target: $75,700–$76,000 (currently the clearest major liquidity pool).
》 Downside liquidity (below):
- A strong, pivotal liquidation zone: $72,400–$72,600.
💡 My technical view and analysis of the price action:
The biggest liquidity block is sitting above Bitcoin's head, especially near the 76K barrier.
But be warned: the market isn't stupid, and it doesn't move on emotion; it often likes to go after the nearest liquidity below (downside) first, to liquidate positions and clear out open trades before considering a bullish reversal.
The key right now: keep a close eye on the $74,000 level; if price strongly reclaims and holds above it, that opens the door wide to moving toward the upper liquidity blocks.
#BTC #BinanceSquare #CryptoTrading #Liquidity
Guys, focus with me as we read the liquidation heatmap for $BTC ;
Bitcoin has eaten up and swallowed nearby liquidity around $72,700–$73,000, but the chart is still packed with huge liquidity clusters above and below, waiting to be targeted!
📊 Reading the heatmap by the numbers (where is liquidity concentrated?):
》 Upside liquidity (above):
- Nearest stop: $74,000
- The largest cluster and major target: $75,700–$76,000 (currently the clearest major liquidity pool).
》 Downside liquidity (below):
- A strong, pivotal liquidation zone: $72,400–$72,600.
💡 My technical view and analysis of the price action:
The biggest liquidity block is sitting above Bitcoin's head, especially near the 76K barrier.
But be warned: the market isn't stupid, and it doesn't move on emotion; it often likes to go after the nearest liquidity below (downside) first, to liquidate positions and clear out open trades before considering a bullish reversal.
The key right now: keep a close eye on the $74,000 level; if price strongly reclaims and holds above it, that opens the door wide to moving toward the upper liquidity blocks.
#BTC #BinanceSquare #CryptoTrading #Liquidity