


$NEAR is down 2,23 percent over the past 24 hours and is now trading around 3,547 dollars. A correction of this scale is not just a one-day move, as the price has already lost nearly 32 percent from its peak over the past month.
The question is simple: is the 0.5 Fibonacci level at 3,423 the bottom of the correction, or just a resting place before a deeper drop? In my view, it can’t be answered yet.
Market Context
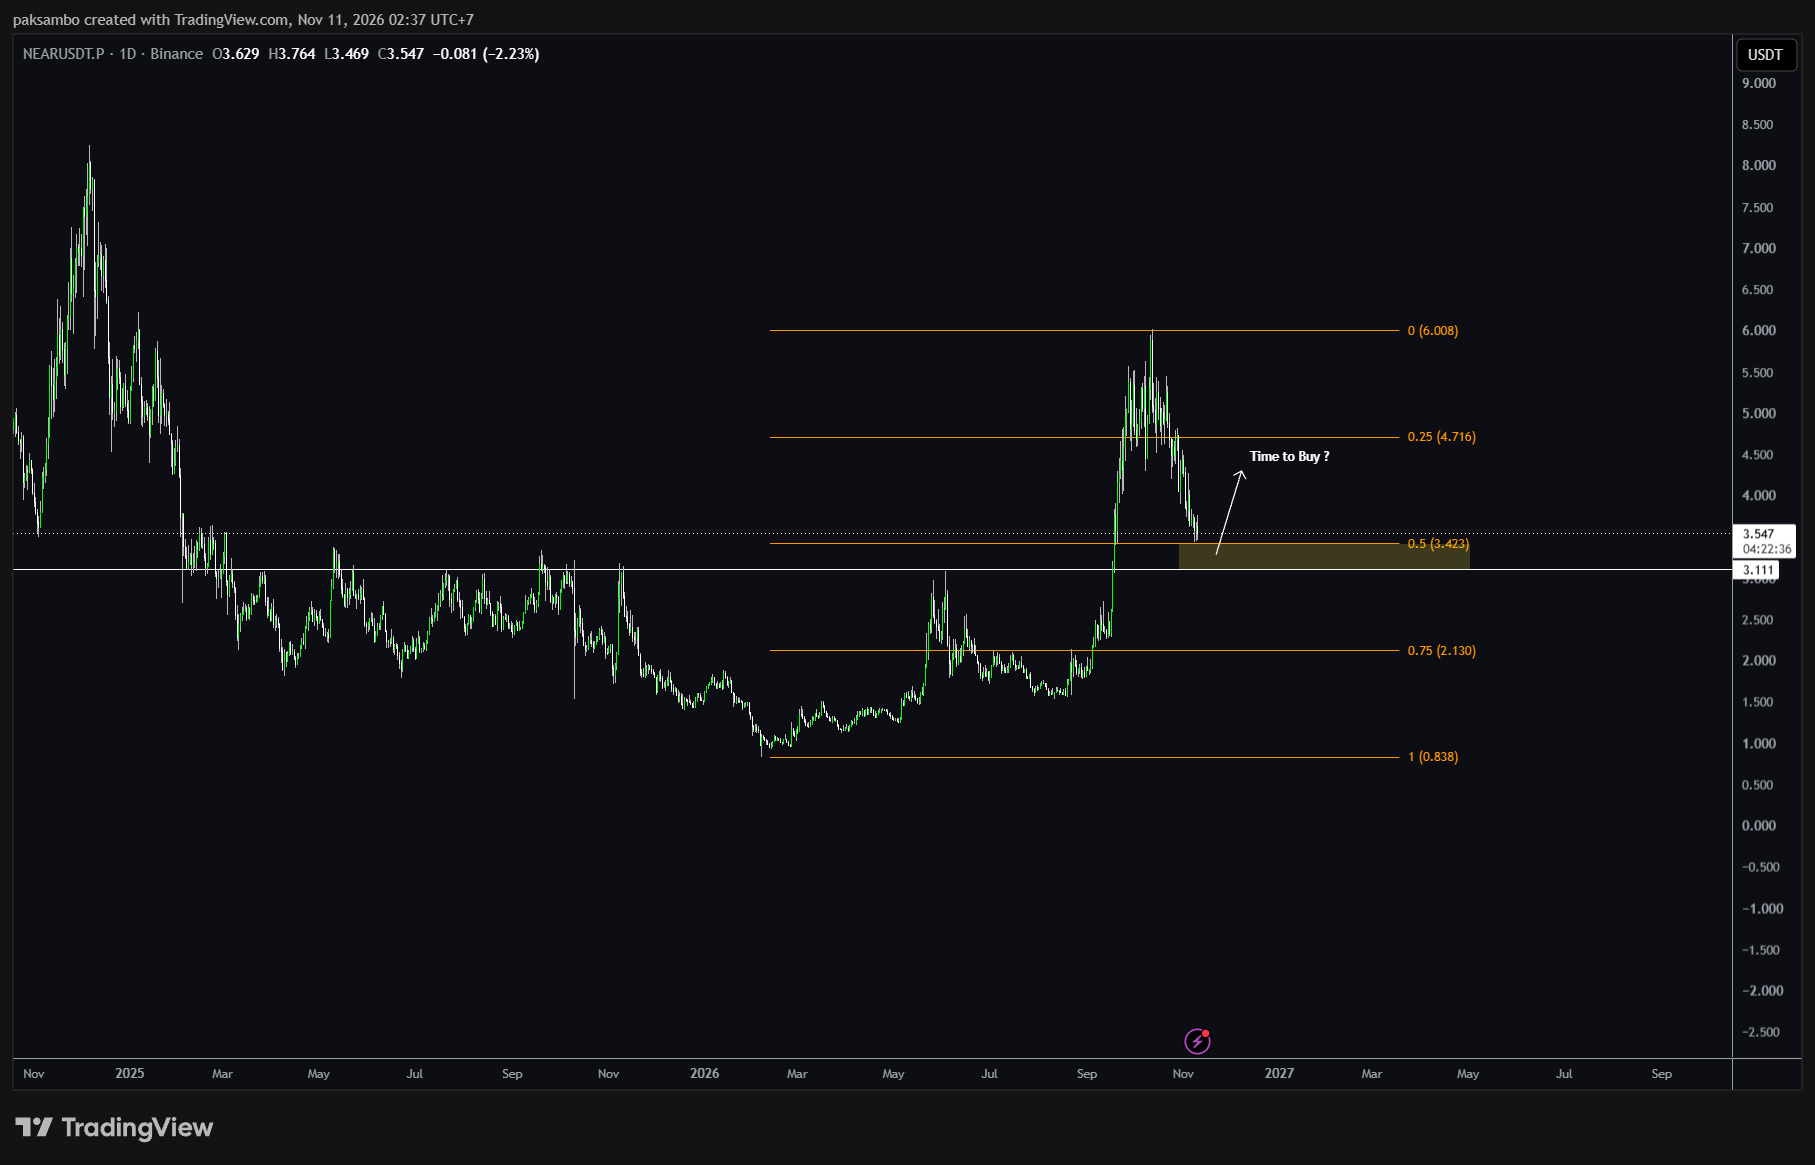
On the daily chart, $NEAR peaked at 6,008 around last September, then fell sharply and is now below the 0.25 Fibonacci level at 4,716. A drop of that magnitude puts the price just above the 0.5 zone.
Interestingly, 3,423 is no ordinary number because it is the midpoint between the low of 0,838 and the peak of 6,008, meaning statistically half of the previous rally has been erased. Below it is 0,75 at 2,130, followed by 3,111, which you marked as the nearest low. The distance from the current price to 3,111 is only around 12 percent, and that is the area most likely to be tested first if selling pressure continues.
The reason I’m not ready to draw a conclusion lies in the derivatives data, where signs of capitulation have yet to appear. Open interest, or the value of open $NEAR futures contracts, is still at 832,46 million dollars, down just 4,30 percent in two days, while 24-hour liquidations totaled 1,54 million dollars, 81,3 percent of which were long positions. These figures are small for a 32 percent correction, so there has not yet been enough position cleanup to say the market has been flushed out.
Key Levels
$4,716, the 0.25 Fibonacci level: the first boundary that needs to be reclaimed for this correction to be considered over, because selling pressure remains dominant as long as the price is below it.
$3,547, the latest price: where things stand now, still above the buying zone but with no confirmation here yet.
$3,423, the 0.5 Fibonacci level: the midpoint of the rise from 0,838 to 6,008 and the area you marked; this level will determine whether 3,111 gets tested.
$3,111, the nearest low: a thin support before the downside opens up further.
$2,130, the 0.75 Fibonacci level: the boundary where the healthy-correction thesis is truly invalidated.
Possible Scenarios
I haven’t taken an aggressive directional bias yet. Before taking a position, I want to see whether 3,423 can hold for at least two daily closes, and whether volume decreases when the price reaches it, as a sign that selling is starting to run out.
If 3,423 holds and the price manages to close above 3,547 with volume coming in, then the path to 4,716 opens up, making that a more worthwhile area to test than the current price. Conversely, if 3,423 breaks on heavy volume and the daily close is below 3,111, then a move toward 2,130 becomes more realistic, and the case for buying in the 0.5 zone should be discarded.
There is one condition that invalidates both branches: if the price moves sideways between 3,111 and 3,547 for several days without meaningful volume. In that situation, neither setup is worth taking, and waiting remains the cheapest option. What invalidates it later won’t be a new level, but time passing without a reaction.
My Take
I choose to wait. The 3,423 level is certainly interesting, but interesting doesn’t mean well-timed. The price is already down 82 percent from its all-time high of 20,44 dollars, and this decline has yet to be accompanied by signs of capitulation in the derivatives data.
The catalysts to watch are coming from the protocol side. On November 2, proposal HSP-029 passed with 99,96 percent support, lowering maximum emissions from 2,5 percent to 1,6 percent over 24 months. This reduces new supply pressure, although it is still awaiting Security Council approval and a 90-day waiting period before taking effect.
On the other hand, the integration of NEAR Intents with Talos officially went live on November 9, opening access to more than 100 assets and 35 networks. These two developments improve the medium-term story, but they do not change the price structure on today’s daily chart.
Not every neat-looking Fibonacci level is an opportunity. This 0.5 level only means something if the market proves it with a reaction, not just an annotation on the chart.
Wait for confirmation, not just a reaction.
Follow @paksambo_ for the next level breakdown.