$BTC
Got up in the middle of the night and checked: 73,200 is gone.
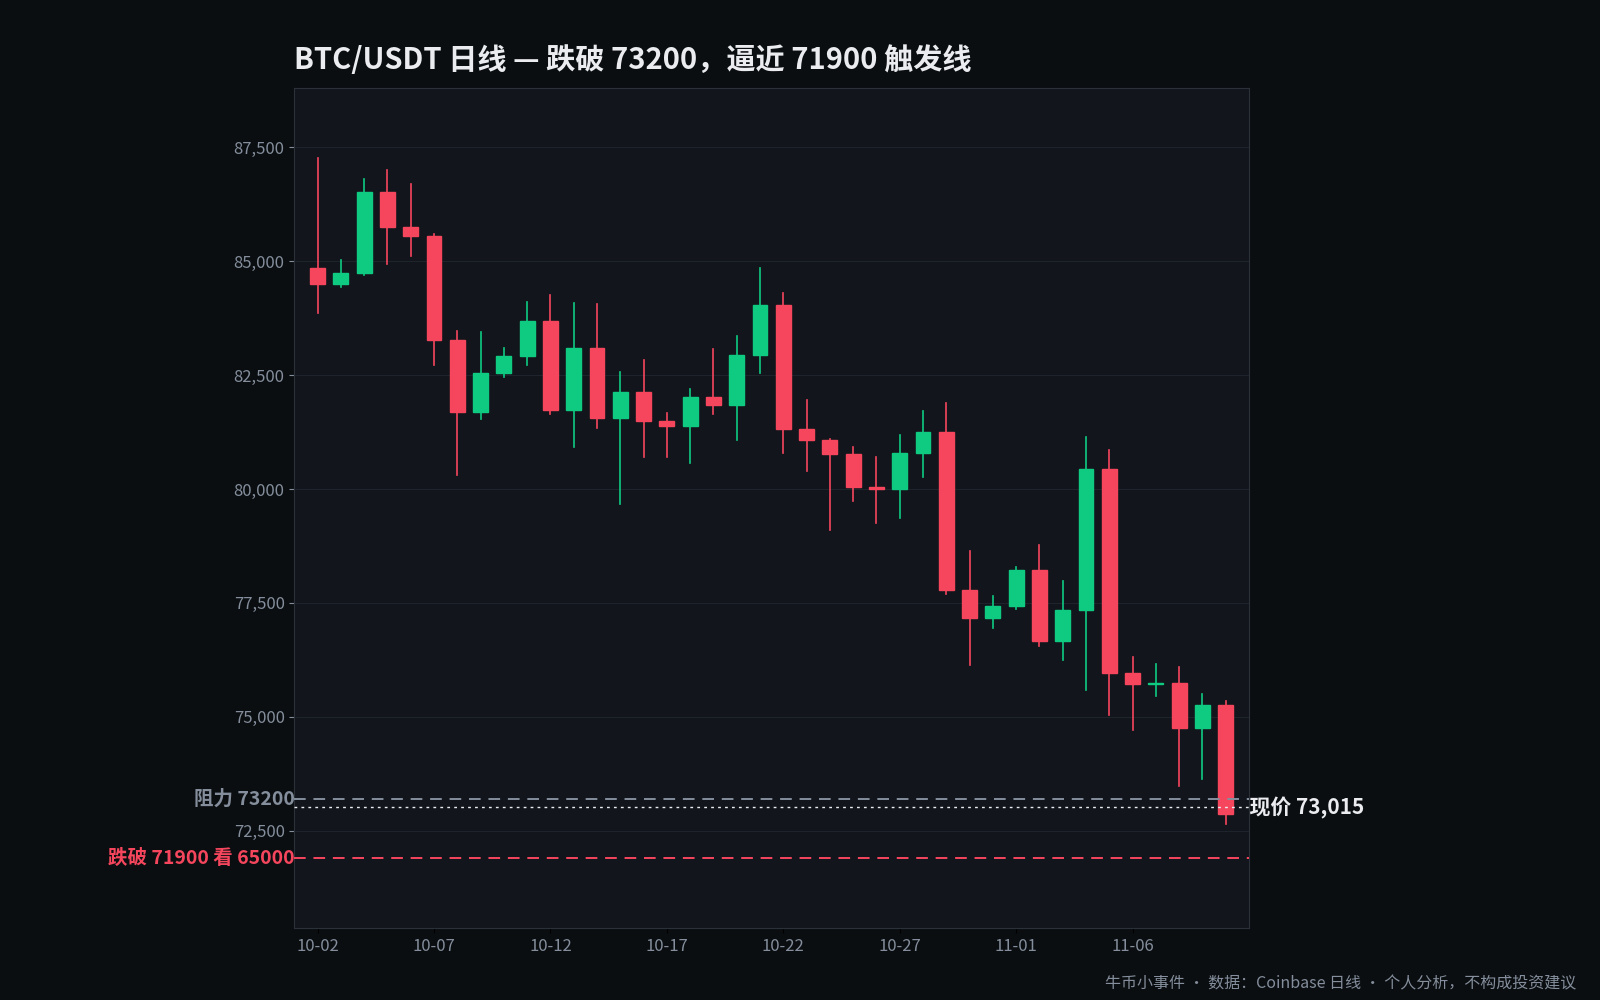
After yesterday’s CPI report, I was still writing that 73,200 was the 200-day moving average and had held all day. Then the overnight session sliced right through it. The current price is 73,015, with an intraday low of 72,727, down 2.5% on the day.
Once this level breaks, the picture changes. 73,200 has flipped from support to resistance. Any bounce needs to reclaim it; otherwise, the bears are still in control.
That leaves 71,900 as the next level below. Hilbert’s warning is still on the table: a break below the 71,900 trendline could send Bitcoin toward 65,000. That’s only about $1,100 from here—not far.
The reasons for the drop aren’t new. Headline CPI came in at +0.4% and core at +0.3%, both above expectations. The odds of a 25-basis-point hike in December jumped to 89%, and Waller said a one-time 50-basis-point hike couldn’t be ruled out. On the ETF front, there was a net outflow of $201 million on November 9, with IBIT seeing seven straight days of outflows. Liquidations over 24 hours hit $356 million, affecting more than 80,000 traders.
ETH is also hovering around 2,050, with its RSI nearing 30. XRP is at 1.06, with an RSI of 24. They’re oversold, sure, but no one wants to catch a falling knife.
I’m not buying the dip here. I’m not turning bullish unless it gets back above 73,200; if it breaks below 71,900 and closes below it on the daily chart, I’ll look lower. If you’re itching to trade, wait for it to hold first—and don’t get carried away with your position size.
Levels: Current price 73,015; resistance at 73,200 / 75,350 (50-week moving average); next level 71,900, with 65,000 in view if it breaks. A move back above 73,200 would put the bearish thesis on pause.
Personal analysis, not investment advice.
#BTC
Got up in the middle of the night and checked: 73,200 is gone.
After yesterday’s CPI report, I was still writing that 73,200 was the 200-day moving average and had held all day. Then the overnight session sliced right through it. The current price is 73,015, with an intraday low of 72,727, down 2.5% on the day.
Once this level breaks, the picture changes. 73,200 has flipped from support to resistance. Any bounce needs to reclaim it; otherwise, the bears are still in control.
That leaves 71,900 as the next level below. Hilbert’s warning is still on the table: a break below the 71,900 trendline could send Bitcoin toward 65,000. That’s only about $1,100 from here—not far.
The reasons for the drop aren’t new. Headline CPI came in at +0.4% and core at +0.3%, both above expectations. The odds of a 25-basis-point hike in December jumped to 89%, and Waller said a one-time 50-basis-point hike couldn’t be ruled out. On the ETF front, there was a net outflow of $201 million on November 9, with IBIT seeing seven straight days of outflows. Liquidations over 24 hours hit $356 million, affecting more than 80,000 traders.
ETH is also hovering around 2,050, with its RSI nearing 30. XRP is at 1.06, with an RSI of 24. They’re oversold, sure, but no one wants to catch a falling knife.
I’m not buying the dip here. I’m not turning bullish unless it gets back above 73,200; if it breaks below 71,900 and closes below it on the daily chart, I’ll look lower. If you’re itching to trade, wait for it to hold first—and don’t get carried away with your position size.
Levels: Current price 73,015; resistance at 73,200 / 75,350 (50-week moving average); next level 71,900, with 65,000 in view if it breaks. A move back above 73,200 would put the bearish thesis on pause.
Personal analysis, not investment advice.
#BTC