$BTC Is Testing Its 200-Day Average 📊
October CPI printed 0.4% vs 0.3% expected, with core at 0.3% vs 0.2%. A December hike was already largely priced in, so the bigger driver was positioning: roughly $178M in longs were liquidated within an hour, and spot ETFs recorded about $1.28B in net outflows last week.
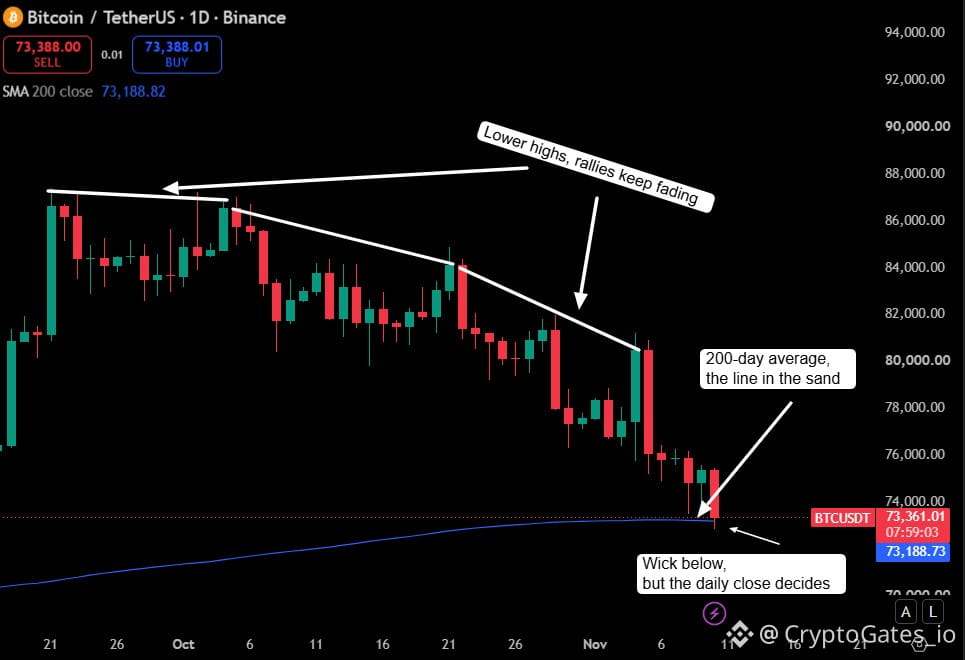
Chart check on BTCUSDT (1D): price $73,361 vs 200-day SMA $73,188. Today’s low of $72,866 dipped below the average, but the daily close has not confirmed anything yet. Highs have also been lower since September.
Scenarios to watch:
✅ Close above the 200-day with improving ETF flows: relief bounce possible
⚠️ Close below: structural support lost, 50bp hike risk matters more
🔄 Sideways: leverage keeps getting flushed both ways
Verify first. Risk later. Scale slowly.
#BTC #CryptoMarkets
October CPI printed 0.4% vs 0.3% expected, with core at 0.3% vs 0.2%. A December hike was already largely priced in, so the bigger driver was positioning: roughly $178M in longs were liquidated within an hour, and spot ETFs recorded about $1.28B in net outflows last week.
Chart check on BTCUSDT (1D): price $73,361 vs 200-day SMA $73,188. Today’s low of $72,866 dipped below the average, but the daily close has not confirmed anything yet. Highs have also been lower since September.
Scenarios to watch:
✅ Close above the 200-day with improving ETF flows: relief bounce possible
⚠️ Close below: structural support lost, 50bp hike risk matters more
🔄 Sideways: leverage keeps getting flushed both ways
Verify first. Risk later. Scale slowly.
#BTC #CryptoMarkets