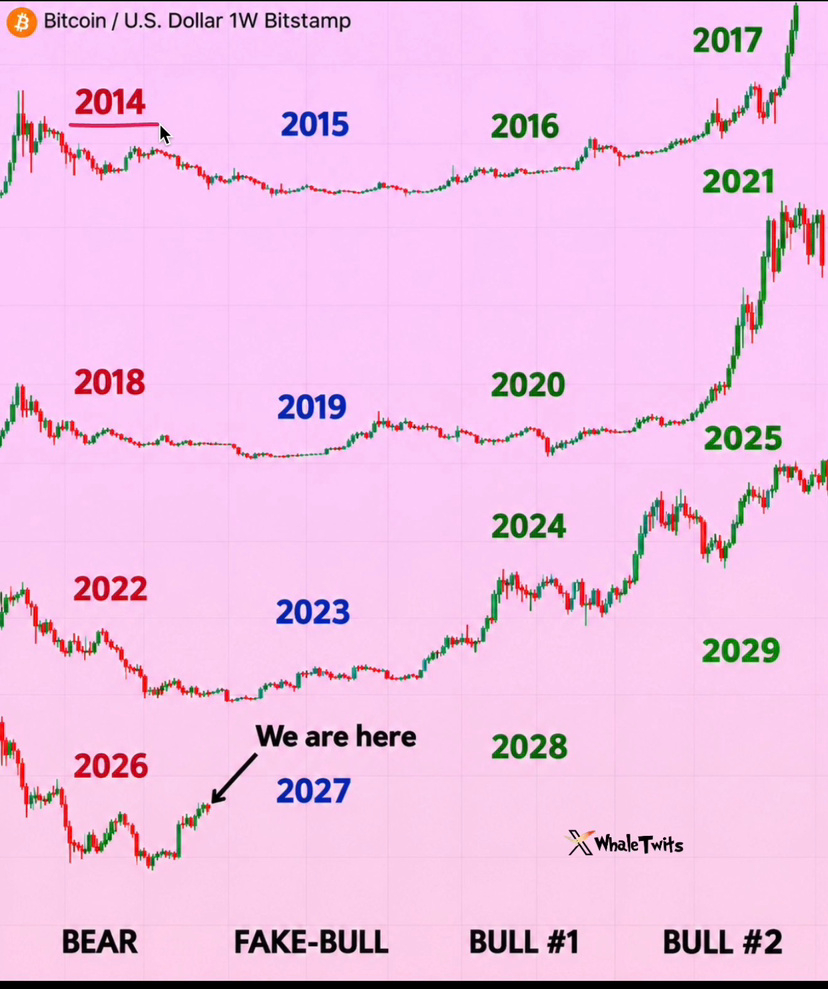
🚨 Bitcoin is repeating the same four-year cycle for the fourth time.
Almost nobody realizes what could happen in 2027.
2014 bear market → 2015 recovery → 2016 first wave → 2017 major bull market
2018 bear market → 2019 recovery → 2020 first wave → 2021 major bull market
2022 bear market → 2023 recovery → 2024 first wave → 2025 top
2026 bear market?
2027 recovery?
2028 first wave?
2029 new highs?
The pattern is clear:
• Bear market years have almost always coincided with U.S. midterm elections
• Recovery happens after the midterms
• The first bull market wave is strongly tied to the halving
• The last three major tops all came about 520–550 days after the halving
But this time, two things are clearly different:
1. A smaller decline: from 126,000 to 58,600, a drop of only about 53% (previously 77%–85%)
2. A faster bottom: it took only 268 days (previously 360–400+ days)
So the question is:
Was 58,600 already the bottom of this cycle?
Or is there one final wave of capitulation ahead?
If the four-year structure continues to repeat, 2027 could very well be the “accumulation year” that everyone only recognizes in hindsight.
The next halving is expected around April 2028.
I can’t guarantee that history will repeat itself, but this pattern has already played out over three complete cycles in a row.
The biggest opportunities have never come when everyone is bullish.
They come when almost nobody believes the next cycle is coming.
Save this chart and come back to it in 2027.
Almost nobody realizes what could happen in 2027.
2014 bear market → 2015 recovery → 2016 first wave → 2017 major bull market
2018 bear market → 2019 recovery → 2020 first wave → 2021 major bull market
2022 bear market → 2023 recovery → 2024 first wave → 2025 top
2026 bear market?
2027 recovery?
2028 first wave?
2029 new highs?
The pattern is clear:
• Bear market years have almost always coincided with U.S. midterm elections
• Recovery happens after the midterms
• The first bull market wave is strongly tied to the halving
• The last three major tops all came about 520–550 days after the halving
But this time, two things are clearly different:
1. A smaller decline: from 126,000 to 58,600, a drop of only about 53% (previously 77%–85%)
2. A faster bottom: it took only 268 days (previously 360–400+ days)
So the question is:
Was 58,600 already the bottom of this cycle?
Or is there one final wave of capitulation ahead?
If the four-year structure continues to repeat, 2027 could very well be the “accumulation year” that everyone only recognizes in hindsight.
The next halving is expected around April 2028.
I can’t guarantee that history will repeat itself, but this pattern has already played out over three complete cycles in a row.
The biggest opportunities have never come when everyone is bullish.
They come when almost nobody believes the next cycle is coming.
Save this chart and come back to it in 2027.