【$TRX at a glance: Hot events + technicals in sync—bullish or a false breakout?】
【Hot event】
The news behind TRX’s latest move came out of nowhere, but the price action is telling the truth.
“U.S. CPI rose stronger than expected 0.4% in October; core rate rose 0.3%” — CoinDesk reported. A December rate hike appears completely assured, with Fed Governor Chris Waller suggesting even a 50-basis-poi…
The biggest risk in event-driven markets is overextended sentiment, so whether key levels hold matters more than the news itself.
【Market snapshot】
$TRX is currently at 0.32020, up 0.76% over 24 hours, with 24-hour trading volume of approximately 20.7M USDT.
【Technical breakdown】
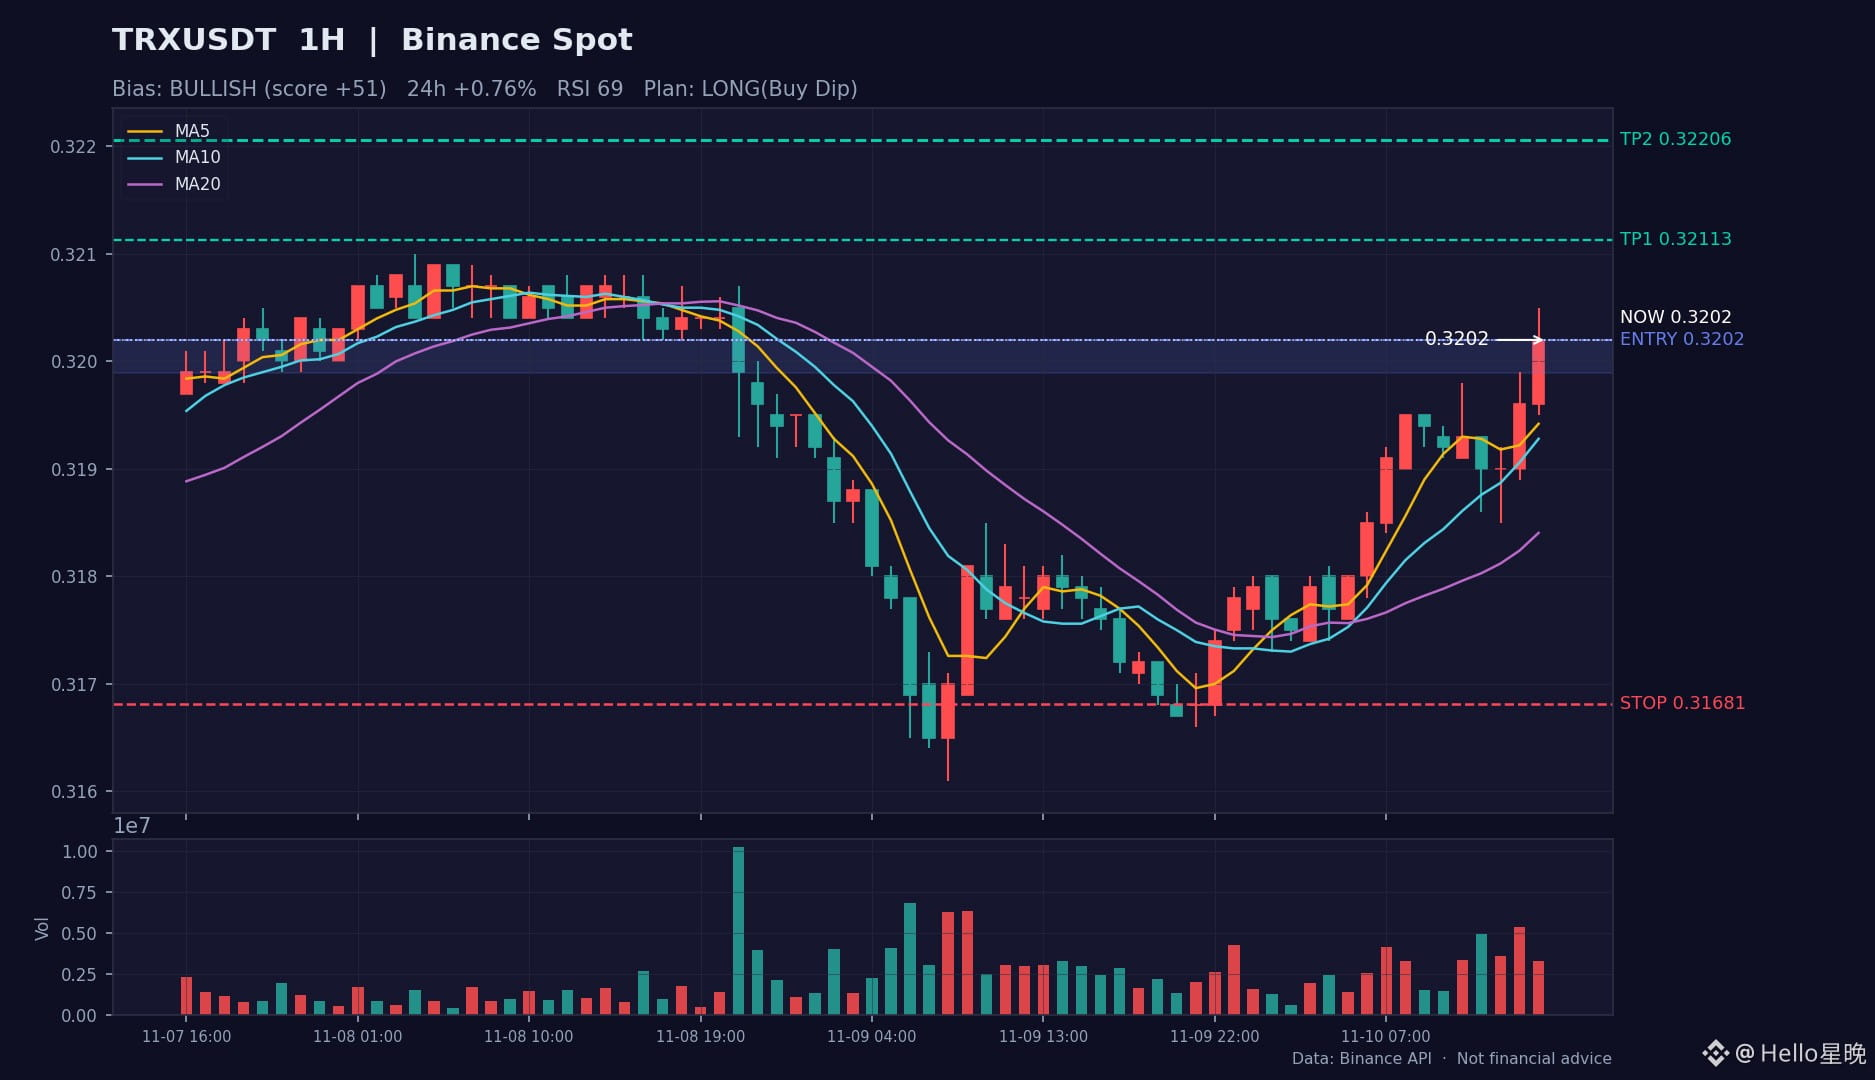
· Moving averages: Short-term MAs have crossed bullishly, and price has moved back above MA20. The trend is recovering, but MA60 has yet to be reclaimed.
· Momentum: The MACD fast line is above the zero line, with the histogram favoring bulls; bullish momentum is continuing. RSI (69) is strong but not overbought, and bullish momentum remains intact.
· Pattern: Price is near the upper Bollinger Band, with a breakout or pullback just around the corner. Volume is picking up moderately (1.2× average), suggesting new capital may be entering.
【Directional outlook】
Overall score: 51/100. Structure leans bullish: moving averages and momentum indicators are aligned to the upside. Until a pullback breaks below the lower boundary of the entry zone, the preference is to scale in on dips. A break above the previous high could put the second target in view; a high-volume break below the stop-loss level invalidates this outlook.
【Sample trading plan】
· Strategy: Buy dips
· Entry zone: 0.31989 ~ 0.32020
· Take profit: First target 0.32113, second target 0.32206
· Stop loss: 0.31681
· Position size: Small, 5%–10%; strictly exit if price falls below the stop-loss level.
· Chart: Candlestick analysis chart included with the post (1-hour chart; red for rising, green for falling; entry zone/take-profit/stop-loss levels marked with colored lines)
【Risk warning】Contracts involve leverage. Getting the direction wrong can mean double the damage. Set your stop loss in the plan and don’t move it manually.
This is only my personal review and technical analysis, and does not constitute investment advice. DYOR.
$TRX #TRX #加密货币 #Market Analysis
【Hot event】
The news behind TRX’s latest move came out of nowhere, but the price action is telling the truth.
“U.S. CPI rose stronger than expected 0.4% in October; core rate rose 0.3%” — CoinDesk reported. A December rate hike appears completely assured, with Fed Governor Chris Waller suggesting even a 50-basis-poi…
The biggest risk in event-driven markets is overextended sentiment, so whether key levels hold matters more than the news itself.
【Market snapshot】
$TRX is currently at 0.32020, up 0.76% over 24 hours, with 24-hour trading volume of approximately 20.7M USDT.
【Technical breakdown】
· Moving averages: Short-term MAs have crossed bullishly, and price has moved back above MA20. The trend is recovering, but MA60 has yet to be reclaimed.
· Momentum: The MACD fast line is above the zero line, with the histogram favoring bulls; bullish momentum is continuing. RSI (69) is strong but not overbought, and bullish momentum remains intact.
· Pattern: Price is near the upper Bollinger Band, with a breakout or pullback just around the corner. Volume is picking up moderately (1.2× average), suggesting new capital may be entering.
【Directional outlook】
Overall score: 51/100. Structure leans bullish: moving averages and momentum indicators are aligned to the upside. Until a pullback breaks below the lower boundary of the entry zone, the preference is to scale in on dips. A break above the previous high could put the second target in view; a high-volume break below the stop-loss level invalidates this outlook.
【Sample trading plan】
· Strategy: Buy dips
· Entry zone: 0.31989 ~ 0.32020
· Take profit: First target 0.32113, second target 0.32206
· Stop loss: 0.31681
· Position size: Small, 5%–10%; strictly exit if price falls below the stop-loss level.
· Chart: Candlestick analysis chart included with the post (1-hour chart; red for rising, green for falling; entry zone/take-profit/stop-loss levels marked with colored lines)
【Risk warning】Contracts involve leverage. Getting the direction wrong can mean double the damage. Set your stop loss in the plan and don’t move it manually.
This is only my personal review and technical analysis, and does not constitute investment advice. DYOR.
$TRX #TRX #加密货币 #Market Analysis