Why has $UNI been so resilient lately?
Looking at the chart, the medium- to long-term structure is actually quite clean.
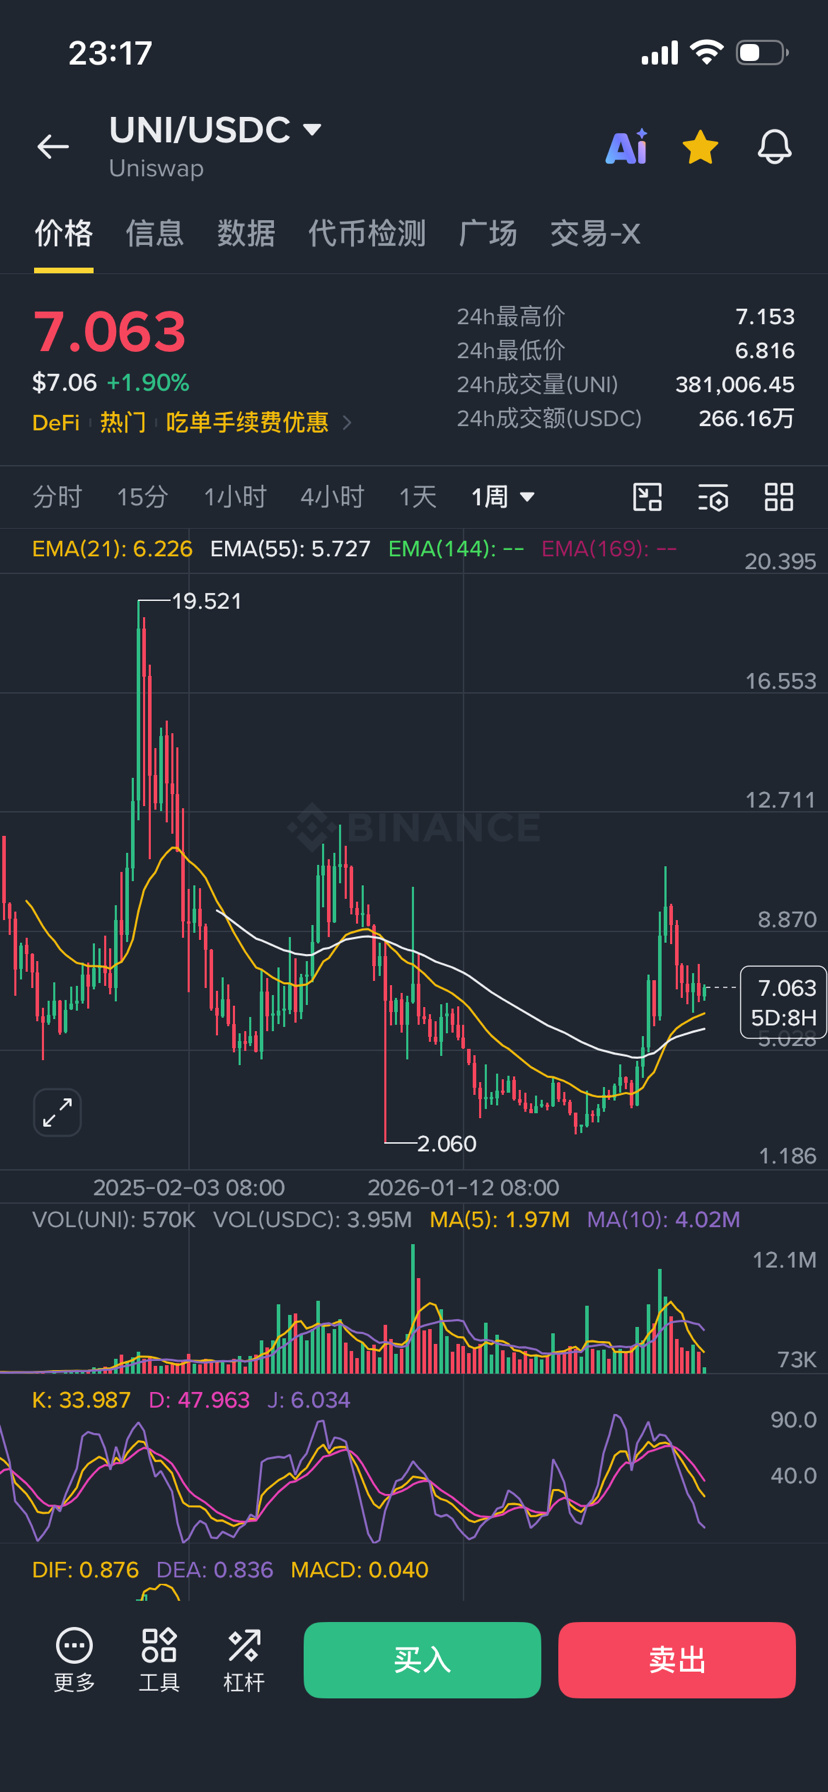
The weekly moving averages are holding, and the price is clearly above EMA21 (around 6.22) and EMA55 (around 5.73), indicating a relatively strong structure.
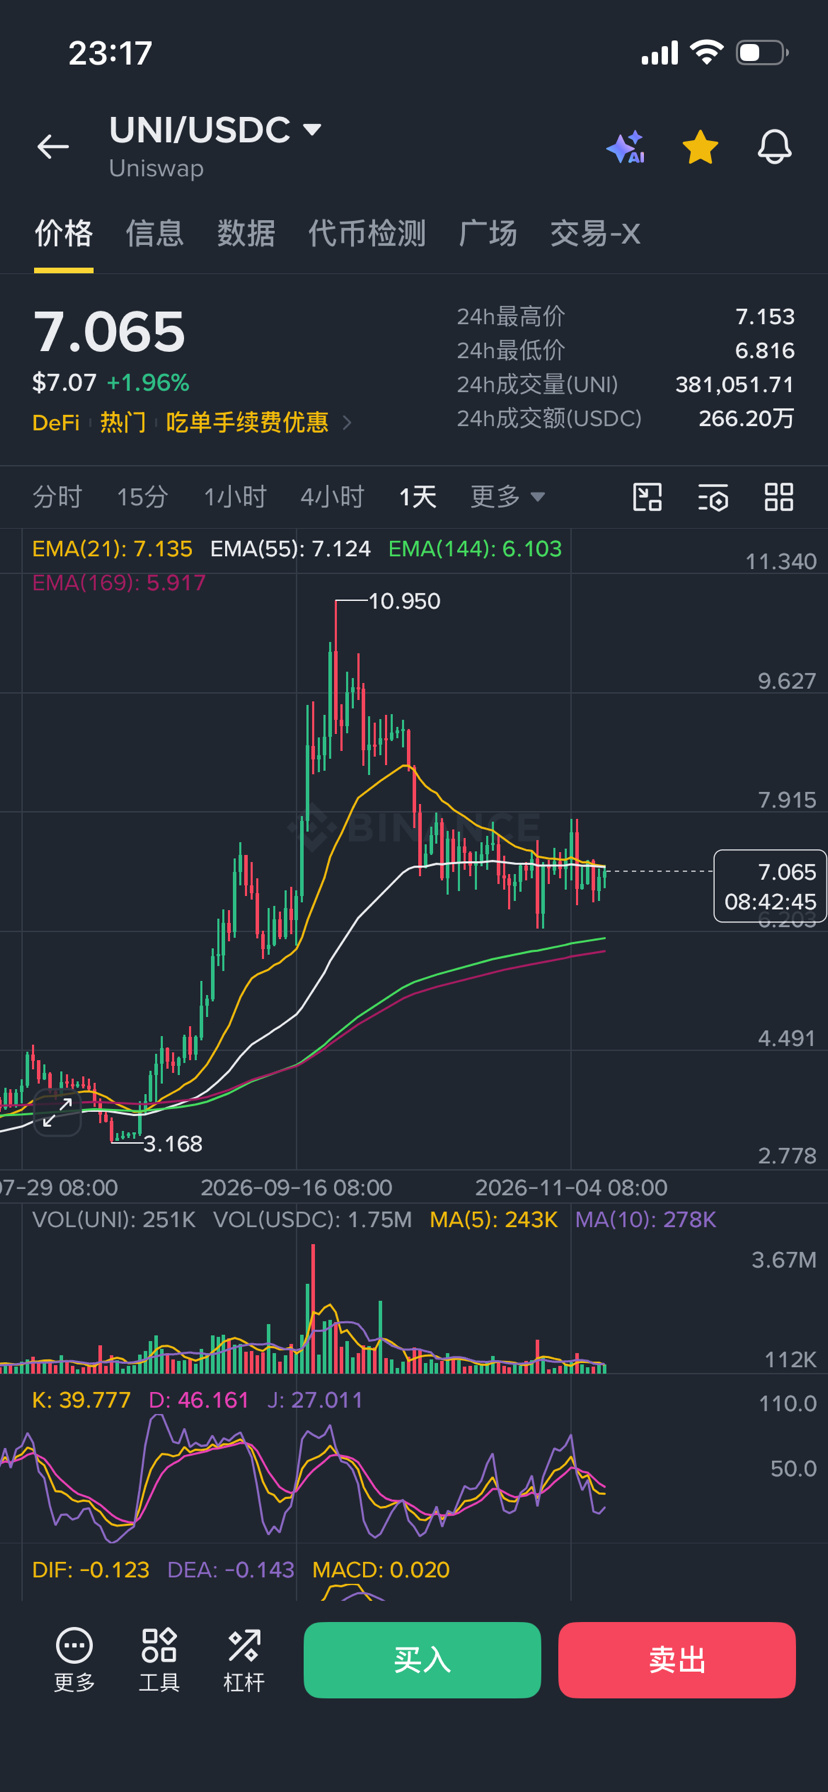
On the daily chart, the price is slightly below EMA21 (7.130) and EMA55 (7.123), hovering around these two short-term moving averages.
The real support is further down at the longer-term EMA144 (6.102) and EMA169 (5.916), and both are still holding.
RSI (6/12/24) is mostly in the 48–56 range, suggesting a neutral balance between bulls and bears.
MACD sometimes moves back and forth around the zero line, with the histogram alternating between positive and negative—showing indecision between bulls and bears.
Volume increases on rises and decreases on declines. This is a typical sign of a healthy pullback, suggesting selling pressure is weak and there is no active sell-off.
The decline is basically due to being dragged down by BTC.
Compared with $BTC , $ETH , and even HYPE, it has been relatively strong lately.
But what really draws my attention isn't the technical picture—it's that the tokenomics have changed.
Since UNIfication, fees have been used directly to burn UNI. This is completely different from when it was purely a governance token.
Where do you think it could reach in the next bull market? #BTC #UNI
Looking at the chart, the medium- to long-term structure is actually quite clean.
The weekly moving averages are holding, and the price is clearly above EMA21 (around 6.22) and EMA55 (around 5.73), indicating a relatively strong structure.
On the daily chart, the price is slightly below EMA21 (7.130) and EMA55 (7.123), hovering around these two short-term moving averages.
The real support is further down at the longer-term EMA144 (6.102) and EMA169 (5.916), and both are still holding.
RSI (6/12/24) is mostly in the 48–56 range, suggesting a neutral balance between bulls and bears.
MACD sometimes moves back and forth around the zero line, with the histogram alternating between positive and negative—showing indecision between bulls and bears.
Volume increases on rises and decreases on declines. This is a typical sign of a healthy pullback, suggesting selling pressure is weak and there is no active sell-off.
The decline is basically due to being dragged down by BTC.
Compared with $BTC , $ETH , and even HYPE, it has been relatively strong lately.
But what really draws my attention isn't the technical picture—it's that the tokenomics have changed.
Since UNIfication, fees have been used directly to burn UNI. This is completely different from when it was purely a governance token.
Where do you think it could reach in the next bull market? #BTC #UNI