Tracking INITUSDT’s Rise: From the Earth’s Crust to the Sky!
If we break down INITUSDT’s price movement using percentage-gain formulas across different timeframes, we can understand how the whales are playing with market psychology. Let’s calculate the exact ratios:
📊 4-Hour Timeframe (4H):
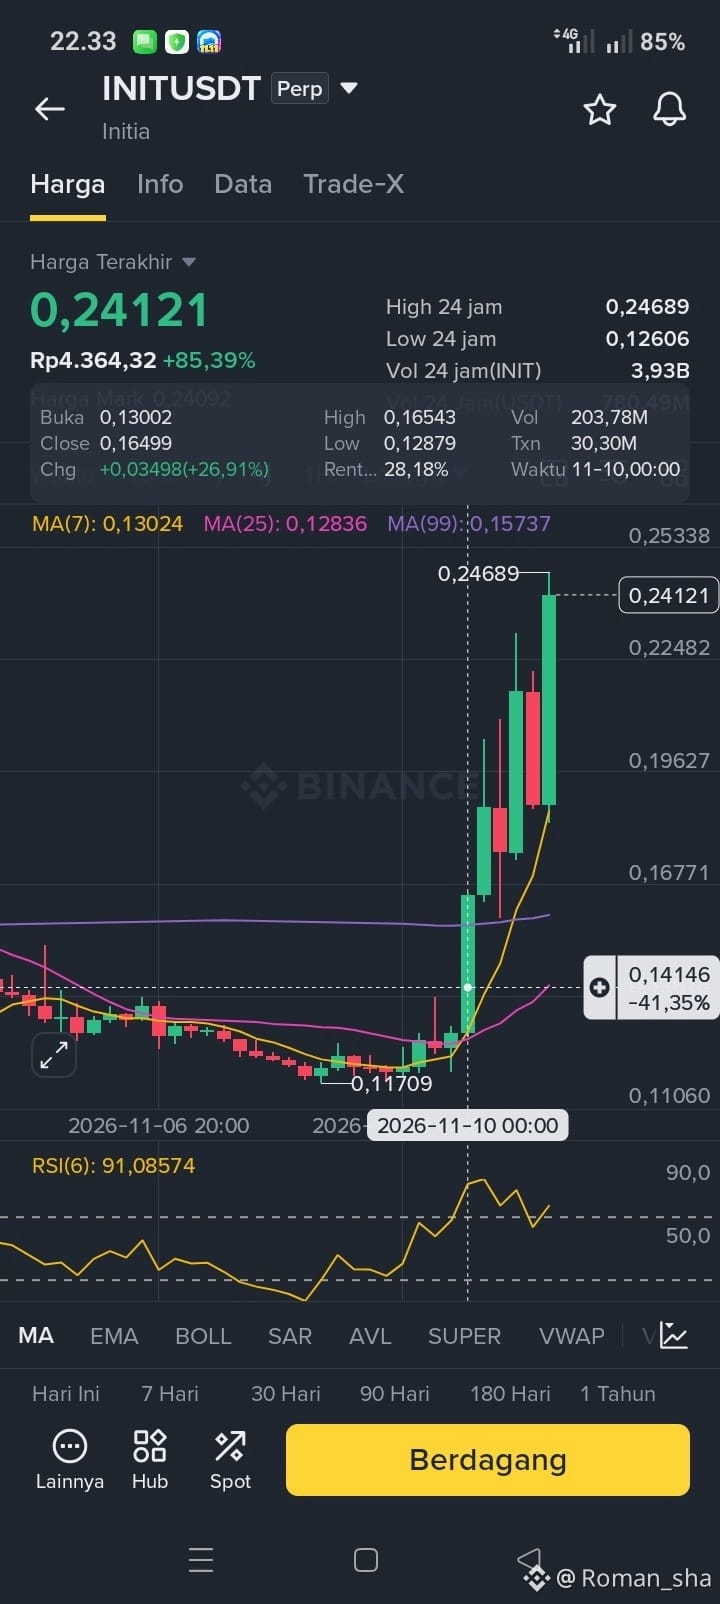
From an opening price of 0.13002, it shot straight up to 0.24121. It took just a few hours to print a lightning-fast surge of +85.52%. The daily RSI(6) immediately exploded to 91.08!
📈 1-Day Timeframe (1D):
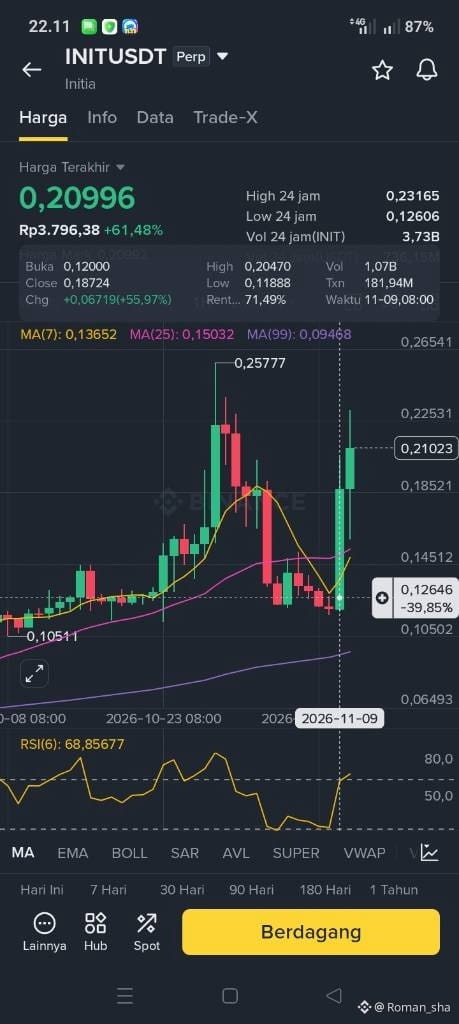
Tracked over the last 2 days, since the November 9 candle opened at 0.12000 and reached 0.21023, this coin has kept charging ahead with a gain of +75.19%. Futures trading volume has gone crazy, soaring into the hundreds of millions of USDT!
🪐 Macro Perspective (1-Month Chart / 1M):
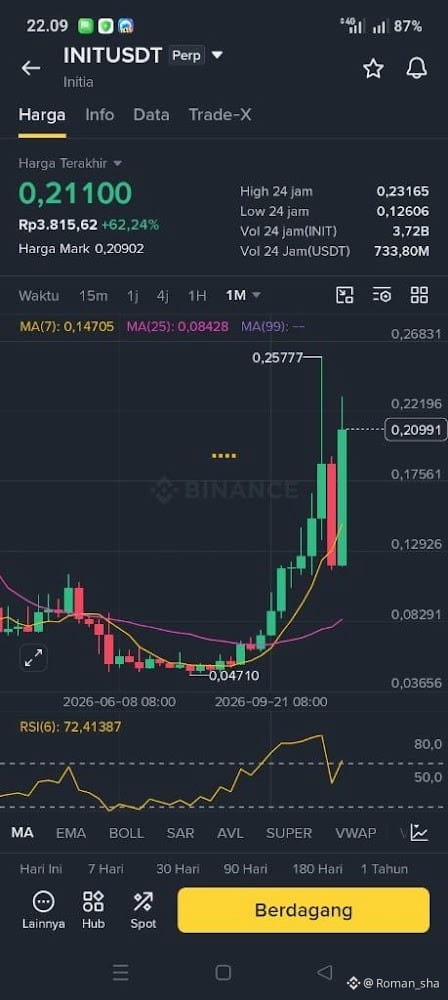
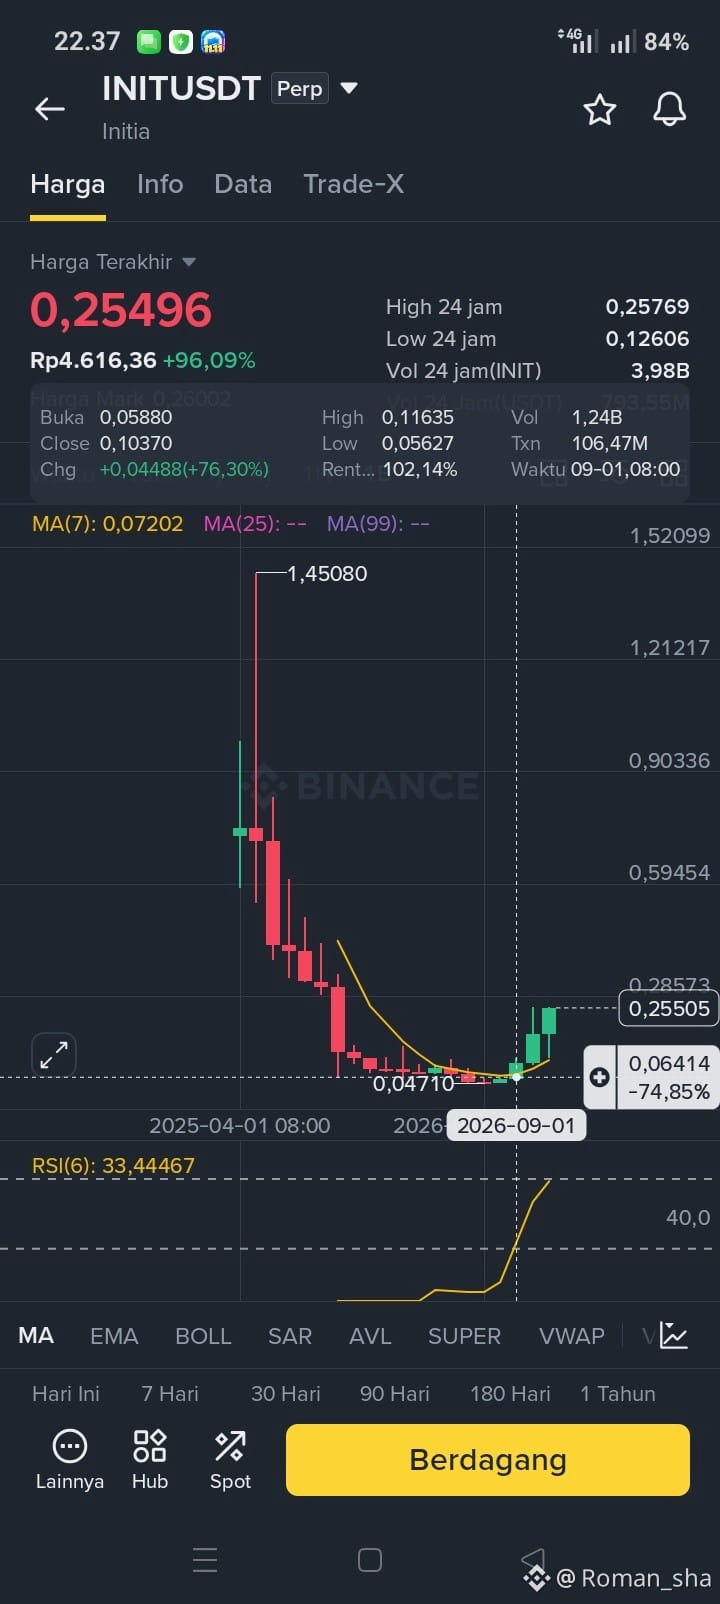
Here’s the ultimate confirmation. Measured from the initial momentum’s opening price of 0.05880 to its current level around 0.25505, INITUSDT has posted a total net gain of +333.76%!
Conclusion:
After being brutally knocked down from its peak of 1.45080 and sleeping for a long time in the Earth’s crust at 0.04710, this coin has definitely just risen from the grave! Its macro momentum is only getting started, but anyone looking to enter should stay alert for a short-term correction, since the scalping indicators are already extremely overheated.
#BinanceSquare
If we break down INITUSDT’s price movement using percentage-gain formulas across different timeframes, we can understand how the whales are playing with market psychology. Let’s calculate the exact ratios:
📊 4-Hour Timeframe (4H):
From an opening price of 0.13002, it shot straight up to 0.24121. It took just a few hours to print a lightning-fast surge of +85.52%. The daily RSI(6) immediately exploded to 91.08!
📈 1-Day Timeframe (1D):
Tracked over the last 2 days, since the November 9 candle opened at 0.12000 and reached 0.21023, this coin has kept charging ahead with a gain of +75.19%. Futures trading volume has gone crazy, soaring into the hundreds of millions of USDT!
🪐 Macro Perspective (1-Month Chart / 1M):
Here’s the ultimate confirmation. Measured from the initial momentum’s opening price of 0.05880 to its current level around 0.25505, INITUSDT has posted a total net gain of +333.76%!
Conclusion:
After being brutally knocked down from its peak of 1.45080 and sleeping for a long time in the Earth’s crust at 0.04710, this coin has definitely just risen from the grave! Its macro momentum is only getting started, but anyone looking to enter should stay alert for a short-term correction, since the scalping indicators are already extremely overheated.
#BinanceSquare