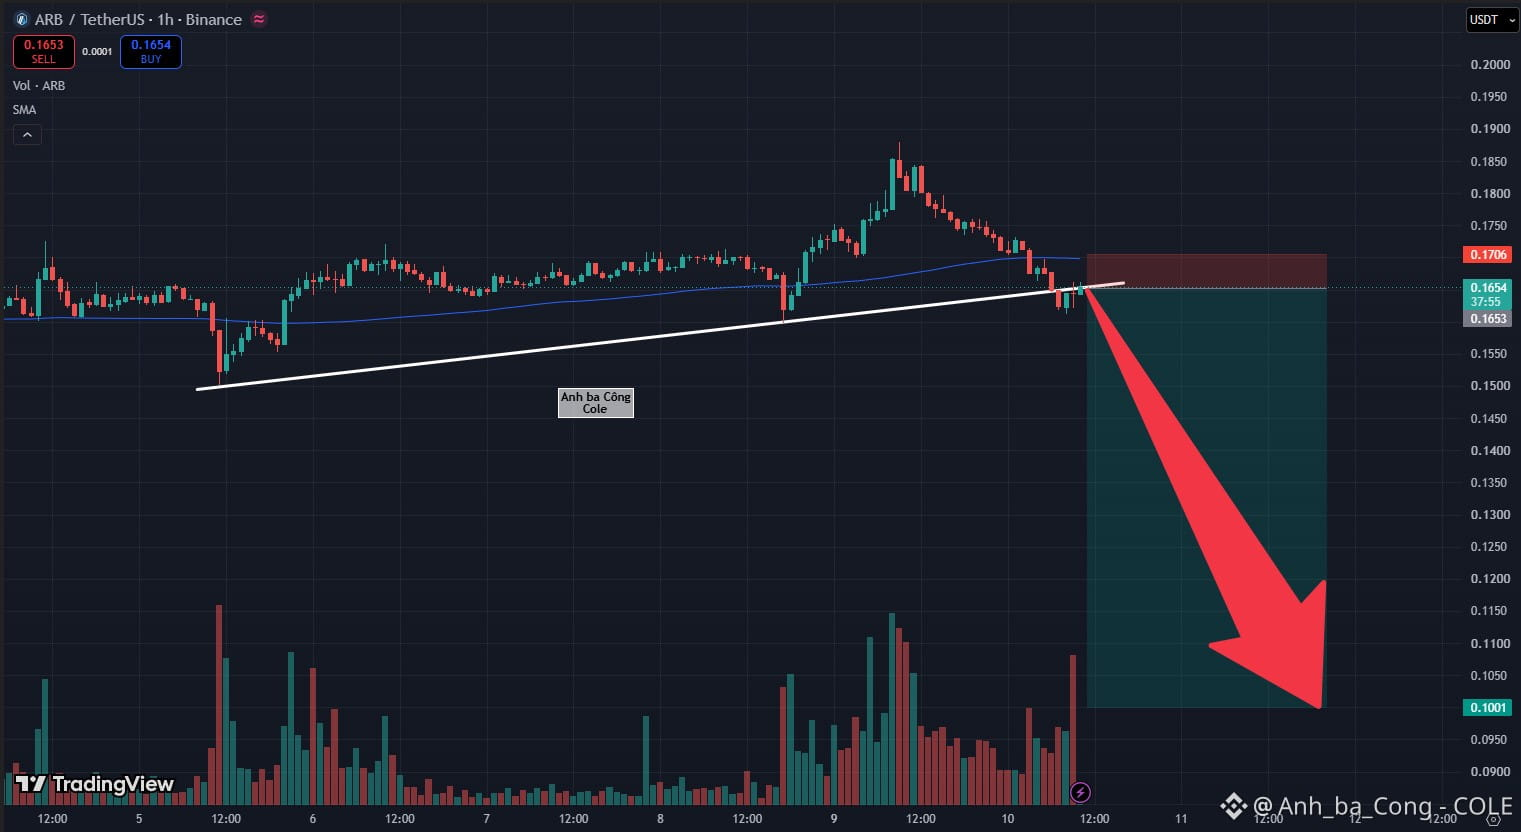
1H Relief Trap Exposed: ARB Loses Ascending Trendline and MA100, Freefall Toward 0.10 USD Underway?
Traders looking to buy the shallow bounce on ARB near 0.165 USD need to step back and evaluate the structural reality unfolding on the 1H chart! Filtering out wishful thinking, the most vital ascending baseline supporting this entire recent swing has officially shattered.
Let's break down the technical tape:
Following the distribution peak at 0.187 USD, lower highs and lower lows have systematically unfolded under relentless institutional distribution.
The ascending white trendline that defended price from the 0.150 USD base was sliced cleanly by heavy red expansion candles.
Price simultaneously broke below the dynamic blue MA100 baseline, confirming that the short-term trend has officially flipped bearish!
What is the tape telling us? The active 1H candle hovering near 0.1654 USD is executing a shallow retest along the broken trendline's underside. The moment price touched resistance, upper rejection wicks immediately appeared, signaling aggressive seller defense. Volume indicators confirm that buying volume on this recovery has completely dried up! With broader market sentiment leaning heavily risk-off across major exchanges, a low-volume retest following a trend breakdown presents a prime window for bears to drive the next downward leg. The primary structural magnet sits directly at the 0.10 USD psychological benchmark (specifically near 0.1001 USD)!
Actionable execution setup:
Position: Trend-continuation Short entry around 0.1650 – 0.1660 USD.
Target (TP): Macro psychological floor at 0.1001 USD (nearly 40% downside potential).
Protective Stop-Loss (SL): 0.1706 USD (safely positioned above the MA100 and broken trendline).
Risk-to-Reward Ratio: Highly asymmetric, risking roughly 0.0052 points to capture an expansive 0.0653+ point decline!
DYOR $ARB
Traders looking to buy the shallow bounce on ARB near 0.165 USD need to step back and evaluate the structural reality unfolding on the 1H chart! Filtering out wishful thinking, the most vital ascending baseline supporting this entire recent swing has officially shattered.
Let's break down the technical tape:
Following the distribution peak at 0.187 USD, lower highs and lower lows have systematically unfolded under relentless institutional distribution.
The ascending white trendline that defended price from the 0.150 USD base was sliced cleanly by heavy red expansion candles.
Price simultaneously broke below the dynamic blue MA100 baseline, confirming that the short-term trend has officially flipped bearish!
What is the tape telling us? The active 1H candle hovering near 0.1654 USD is executing a shallow retest along the broken trendline's underside. The moment price touched resistance, upper rejection wicks immediately appeared, signaling aggressive seller defense. Volume indicators confirm that buying volume on this recovery has completely dried up! With broader market sentiment leaning heavily risk-off across major exchanges, a low-volume retest following a trend breakdown presents a prime window for bears to drive the next downward leg. The primary structural magnet sits directly at the 0.10 USD psychological benchmark (specifically near 0.1001 USD)!
Actionable execution setup:
Position: Trend-continuation Short entry around 0.1650 – 0.1660 USD.
Target (TP): Macro psychological floor at 0.1001 USD (nearly 40% downside potential).
Protective Stop-Loss (SL): 0.1706 USD (safely positioned above the MA100 and broken trendline).
Risk-to-Reward Ratio: Highly asymmetric, risking roughly 0.0052 points to capture an expansive 0.0653+ point decline!
DYOR $ARB