I just finished eating takeout and took a quick look at the charts. $BTC has been making some interesting moves over the past couple of days.
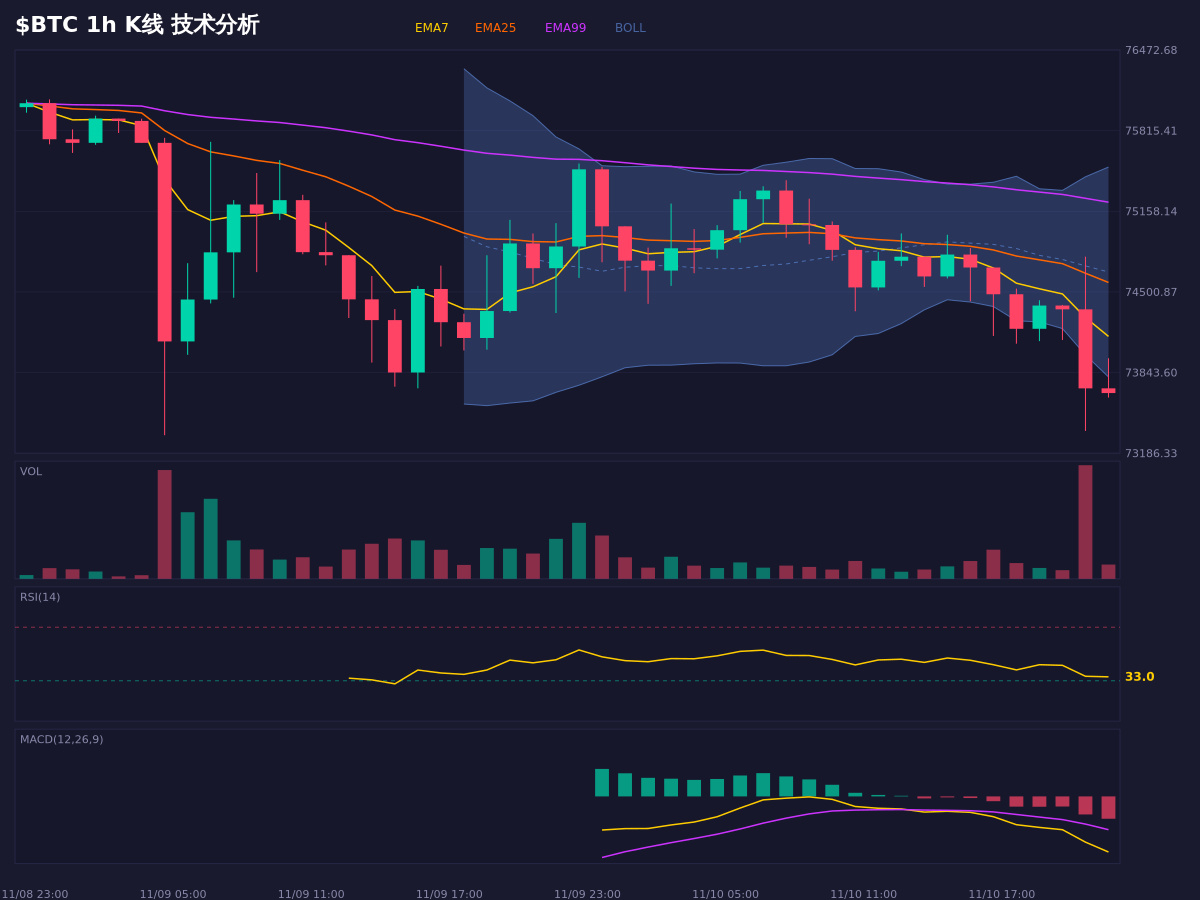
Looking at the moving averages, EMA7, EMA25, and EMA99 are currently in a bearish alignment. The overall trend is indeed weak, and the price is still trading below all three moving averages—a fairly clear bearish signal.
But here’s where it gets interesting. The Bollinger Bands show that the price has already fallen below the lower band, while Stoch RSI has also dropped into oversold territory. This usually means the short-term drop has been rather sharp, creating the technical possibility of an oversold bounce. The bearish MACD histogram bars are also shrinking, which may suggest that although bears are in control, the downward momentum is starting to ease.
$BTC is now hovering around 73700, with 73671 acting as short-term support below. If it can hold there, the price may try to move up. In the event of a bounce, the first thing to watch is whether it can reclaim and hold EMA7 (around 74147). If it does, it may then test EMA25 (74578). But if the bounce is rejected at these levels, the overall weak structure may persist, so keep an eye on the support below.
Interestingly, the long-short ratio is still elevated at a time like this, suggesting many people remain bullish and sentiment is quite resilient. It’s worth pondering whether this reflects people stubbornly holding on or trying to buy the dip.
The point at which this analysis is invalidated is 76047. If the price breaks above this level and holds there, today’s bearish outlook will likely no longer apply, and we’ll need to reassess.
For chart observation and conditional scenario analysis only; this is not a record of trading activity.
$BTC #牛市 #交易 #Market sentiment
Looking at the moving averages, EMA7, EMA25, and EMA99 are currently in a bearish alignment. The overall trend is indeed weak, and the price is still trading below all three moving averages—a fairly clear bearish signal.
But here’s where it gets interesting. The Bollinger Bands show that the price has already fallen below the lower band, while Stoch RSI has also dropped into oversold territory. This usually means the short-term drop has been rather sharp, creating the technical possibility of an oversold bounce. The bearish MACD histogram bars are also shrinking, which may suggest that although bears are in control, the downward momentum is starting to ease.
$BTC is now hovering around 73700, with 73671 acting as short-term support below. If it can hold there, the price may try to move up. In the event of a bounce, the first thing to watch is whether it can reclaim and hold EMA7 (around 74147). If it does, it may then test EMA25 (74578). But if the bounce is rejected at these levels, the overall weak structure may persist, so keep an eye on the support below.
Interestingly, the long-short ratio is still elevated at a time like this, suggesting many people remain bullish and sentiment is quite resilient. It’s worth pondering whether this reflects people stubbornly holding on or trying to buy the dip.
The point at which this analysis is invalidated is 76047. If the price breaks above this level and holds there, today’s bearish outlook will likely no longer apply, and we’ll need to reassess.
For chart observation and conditional scenario analysis only; this is not a record of trading activity.
$BTC #牛市 #交易 #Market sentiment