Trading Thesis | 11/10 22:20
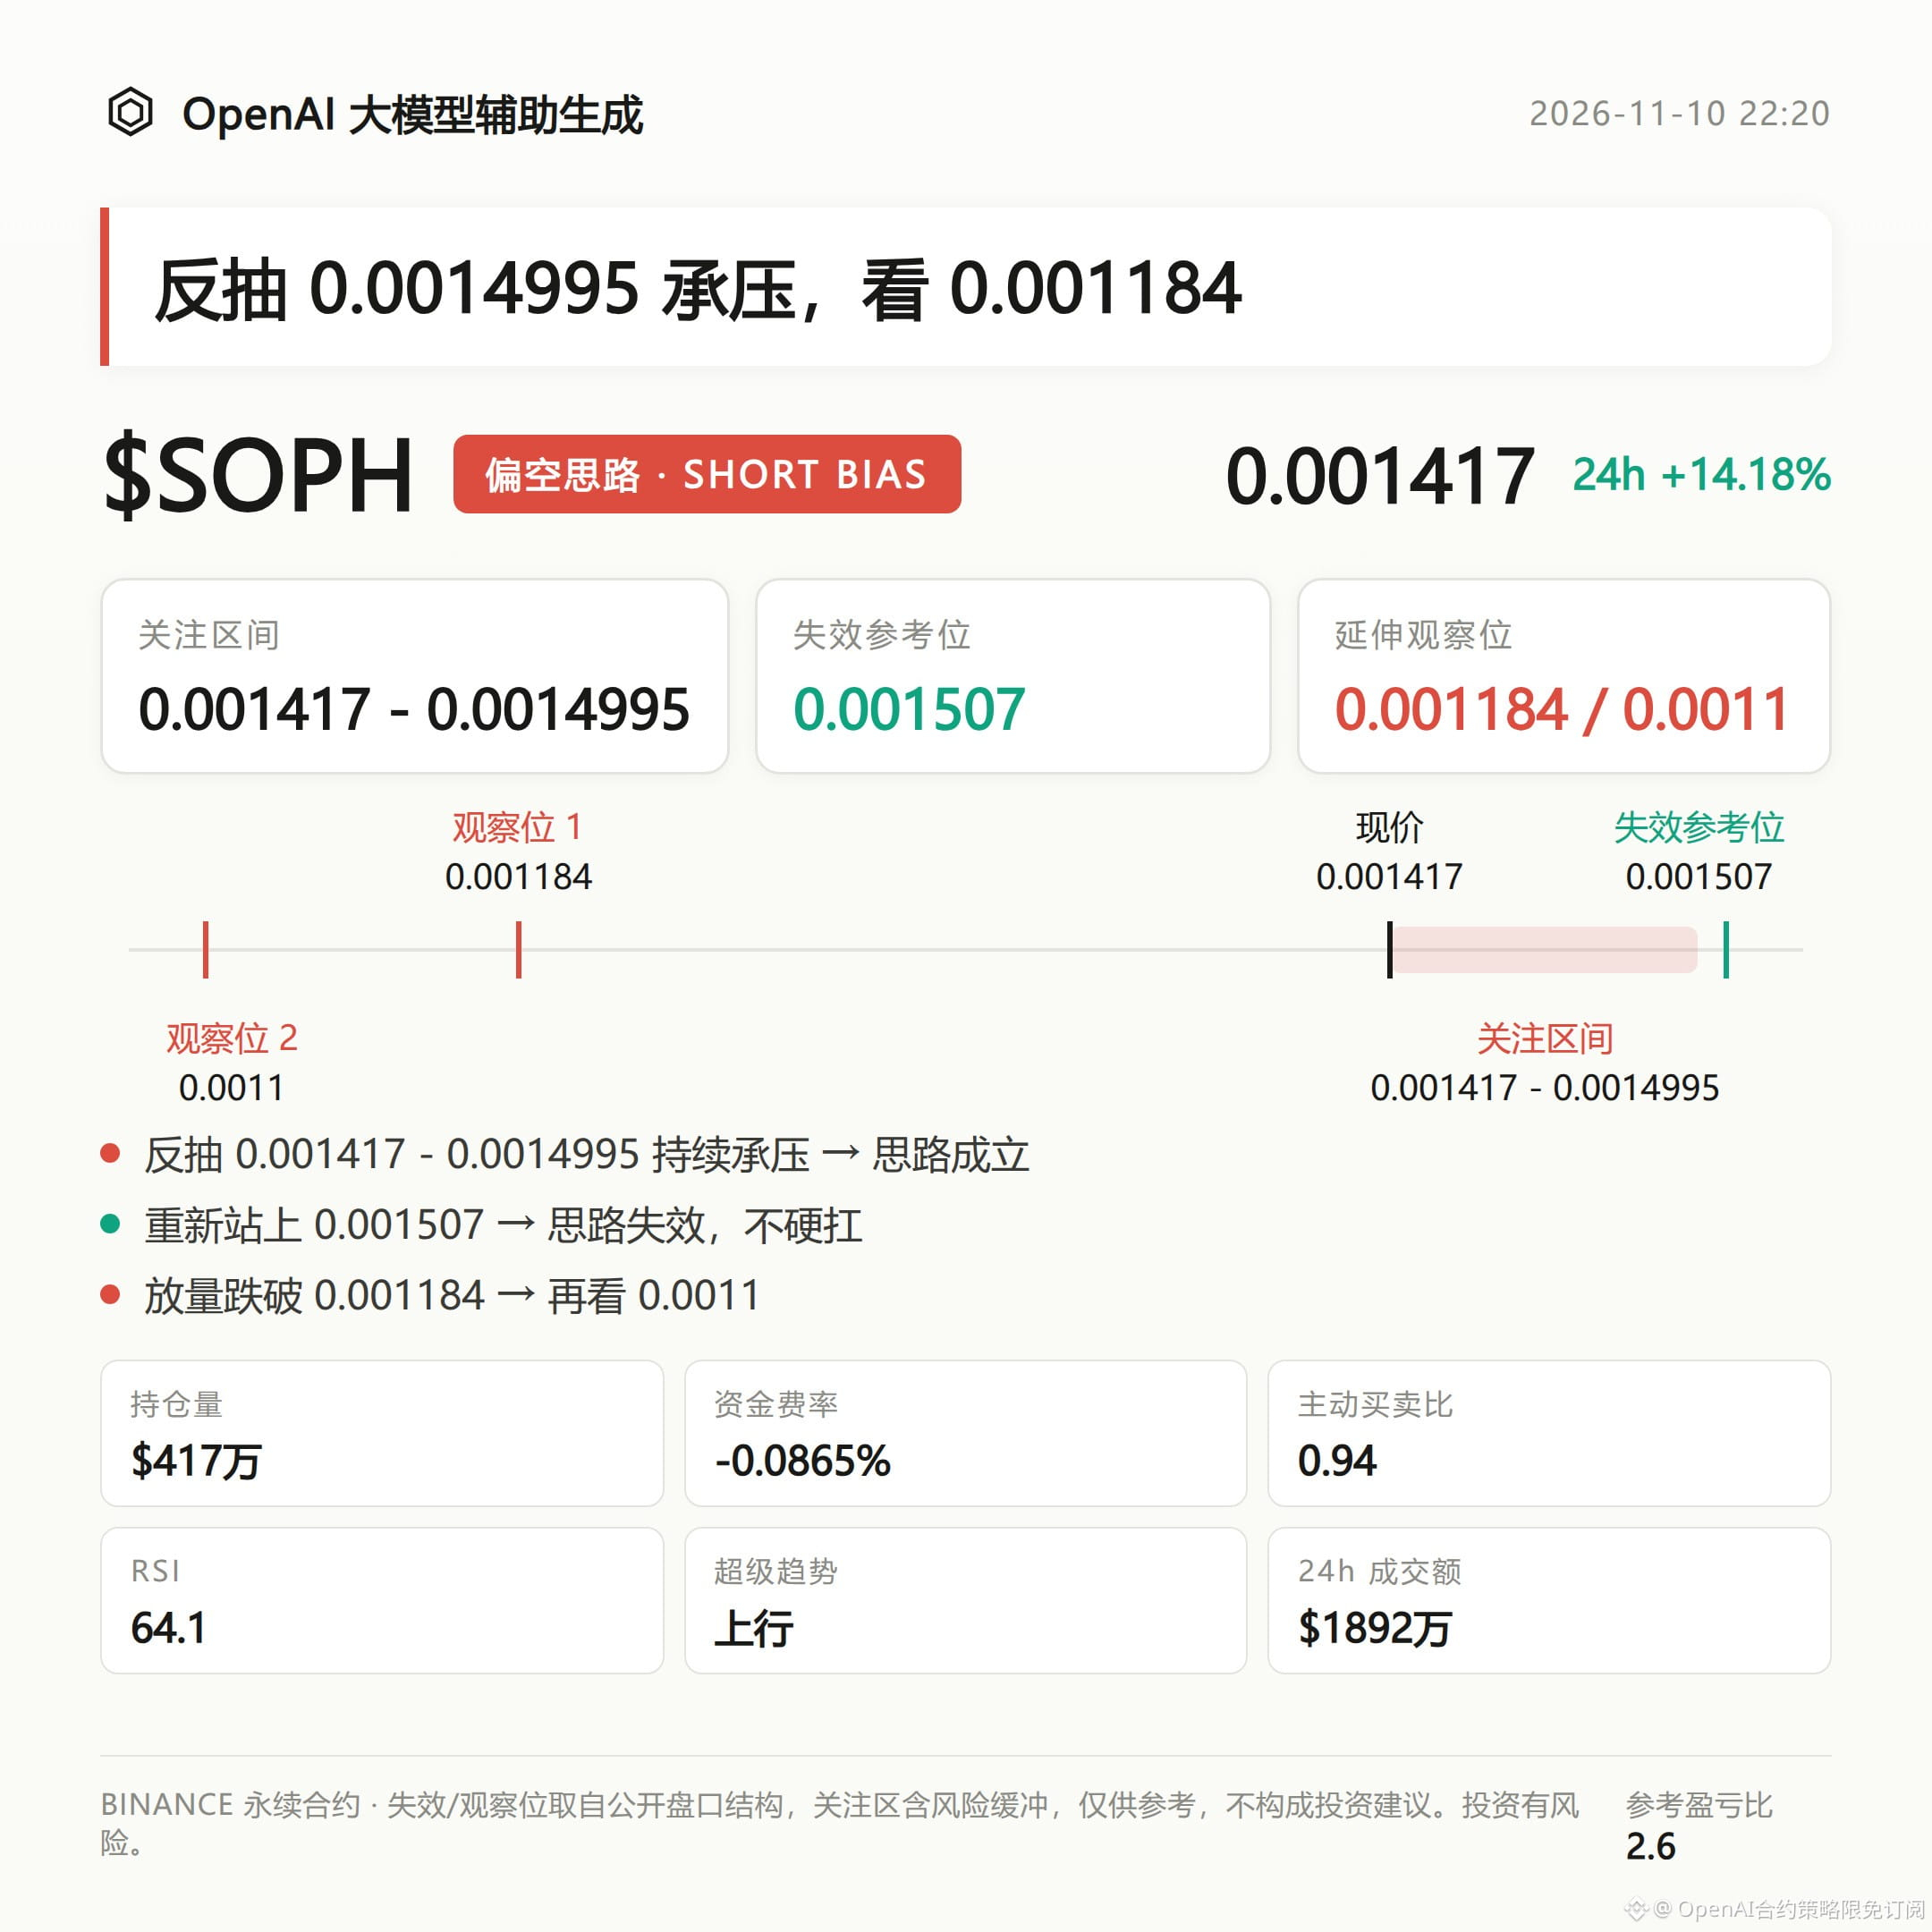
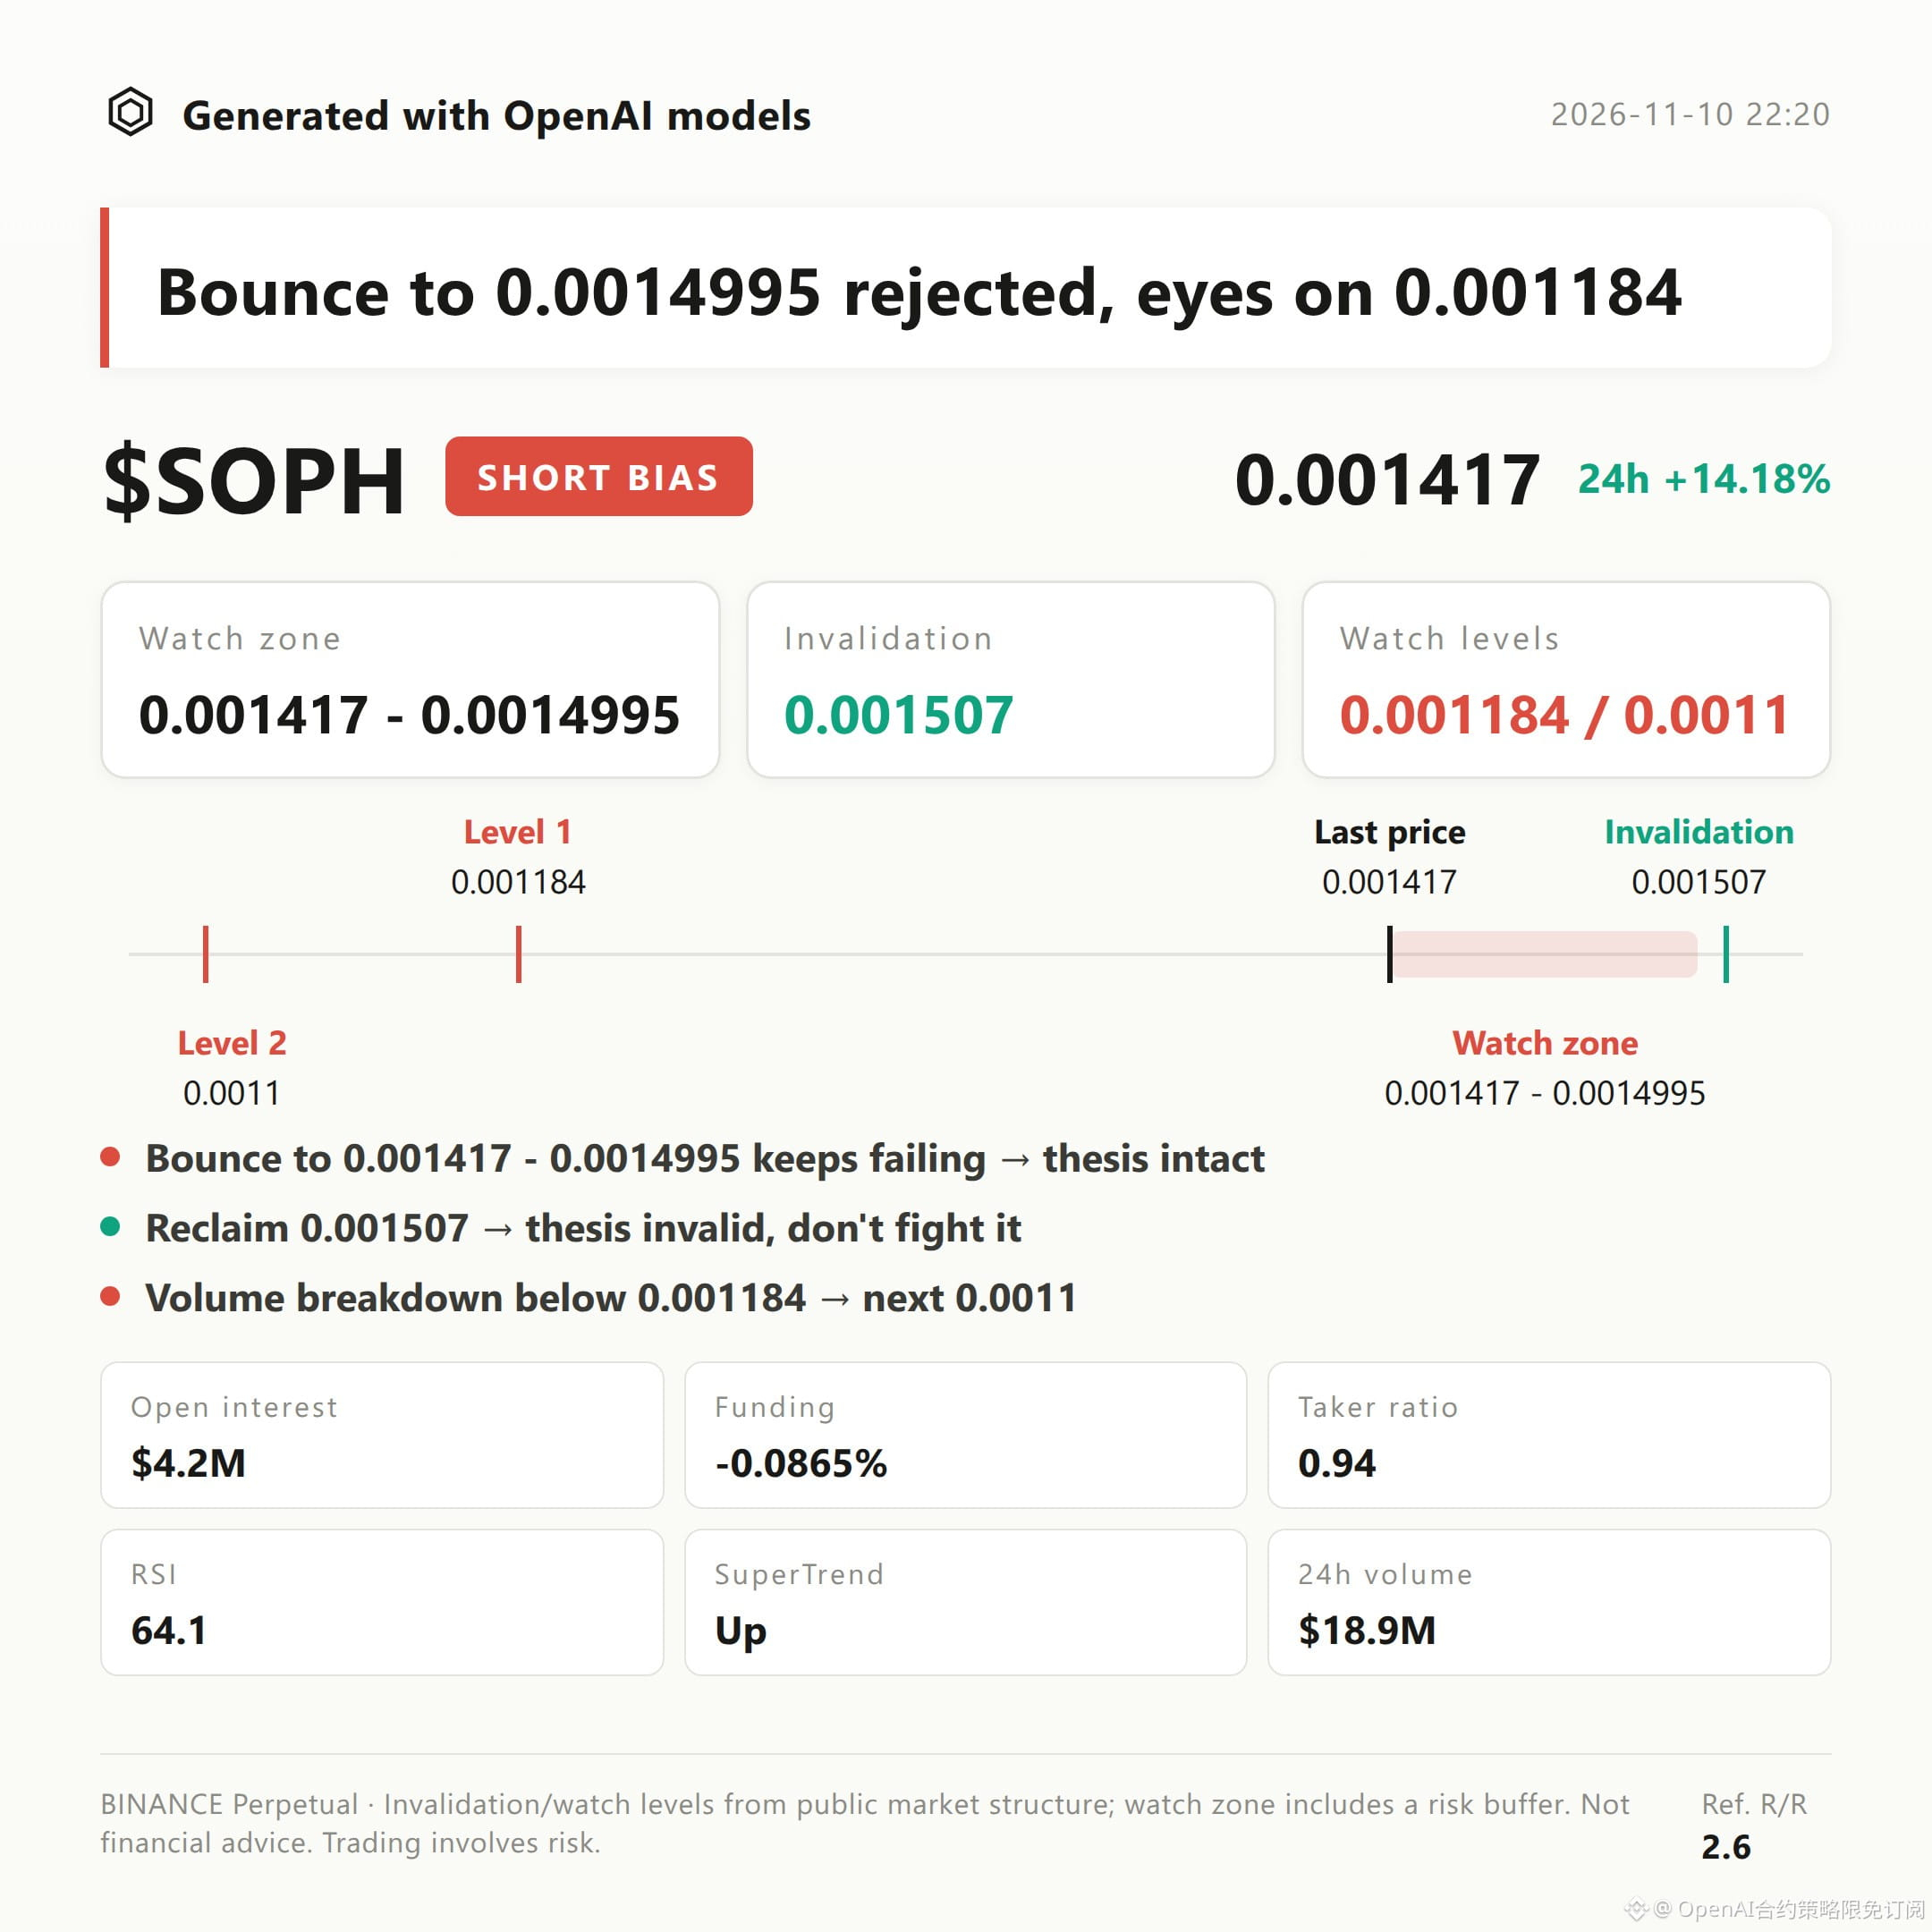
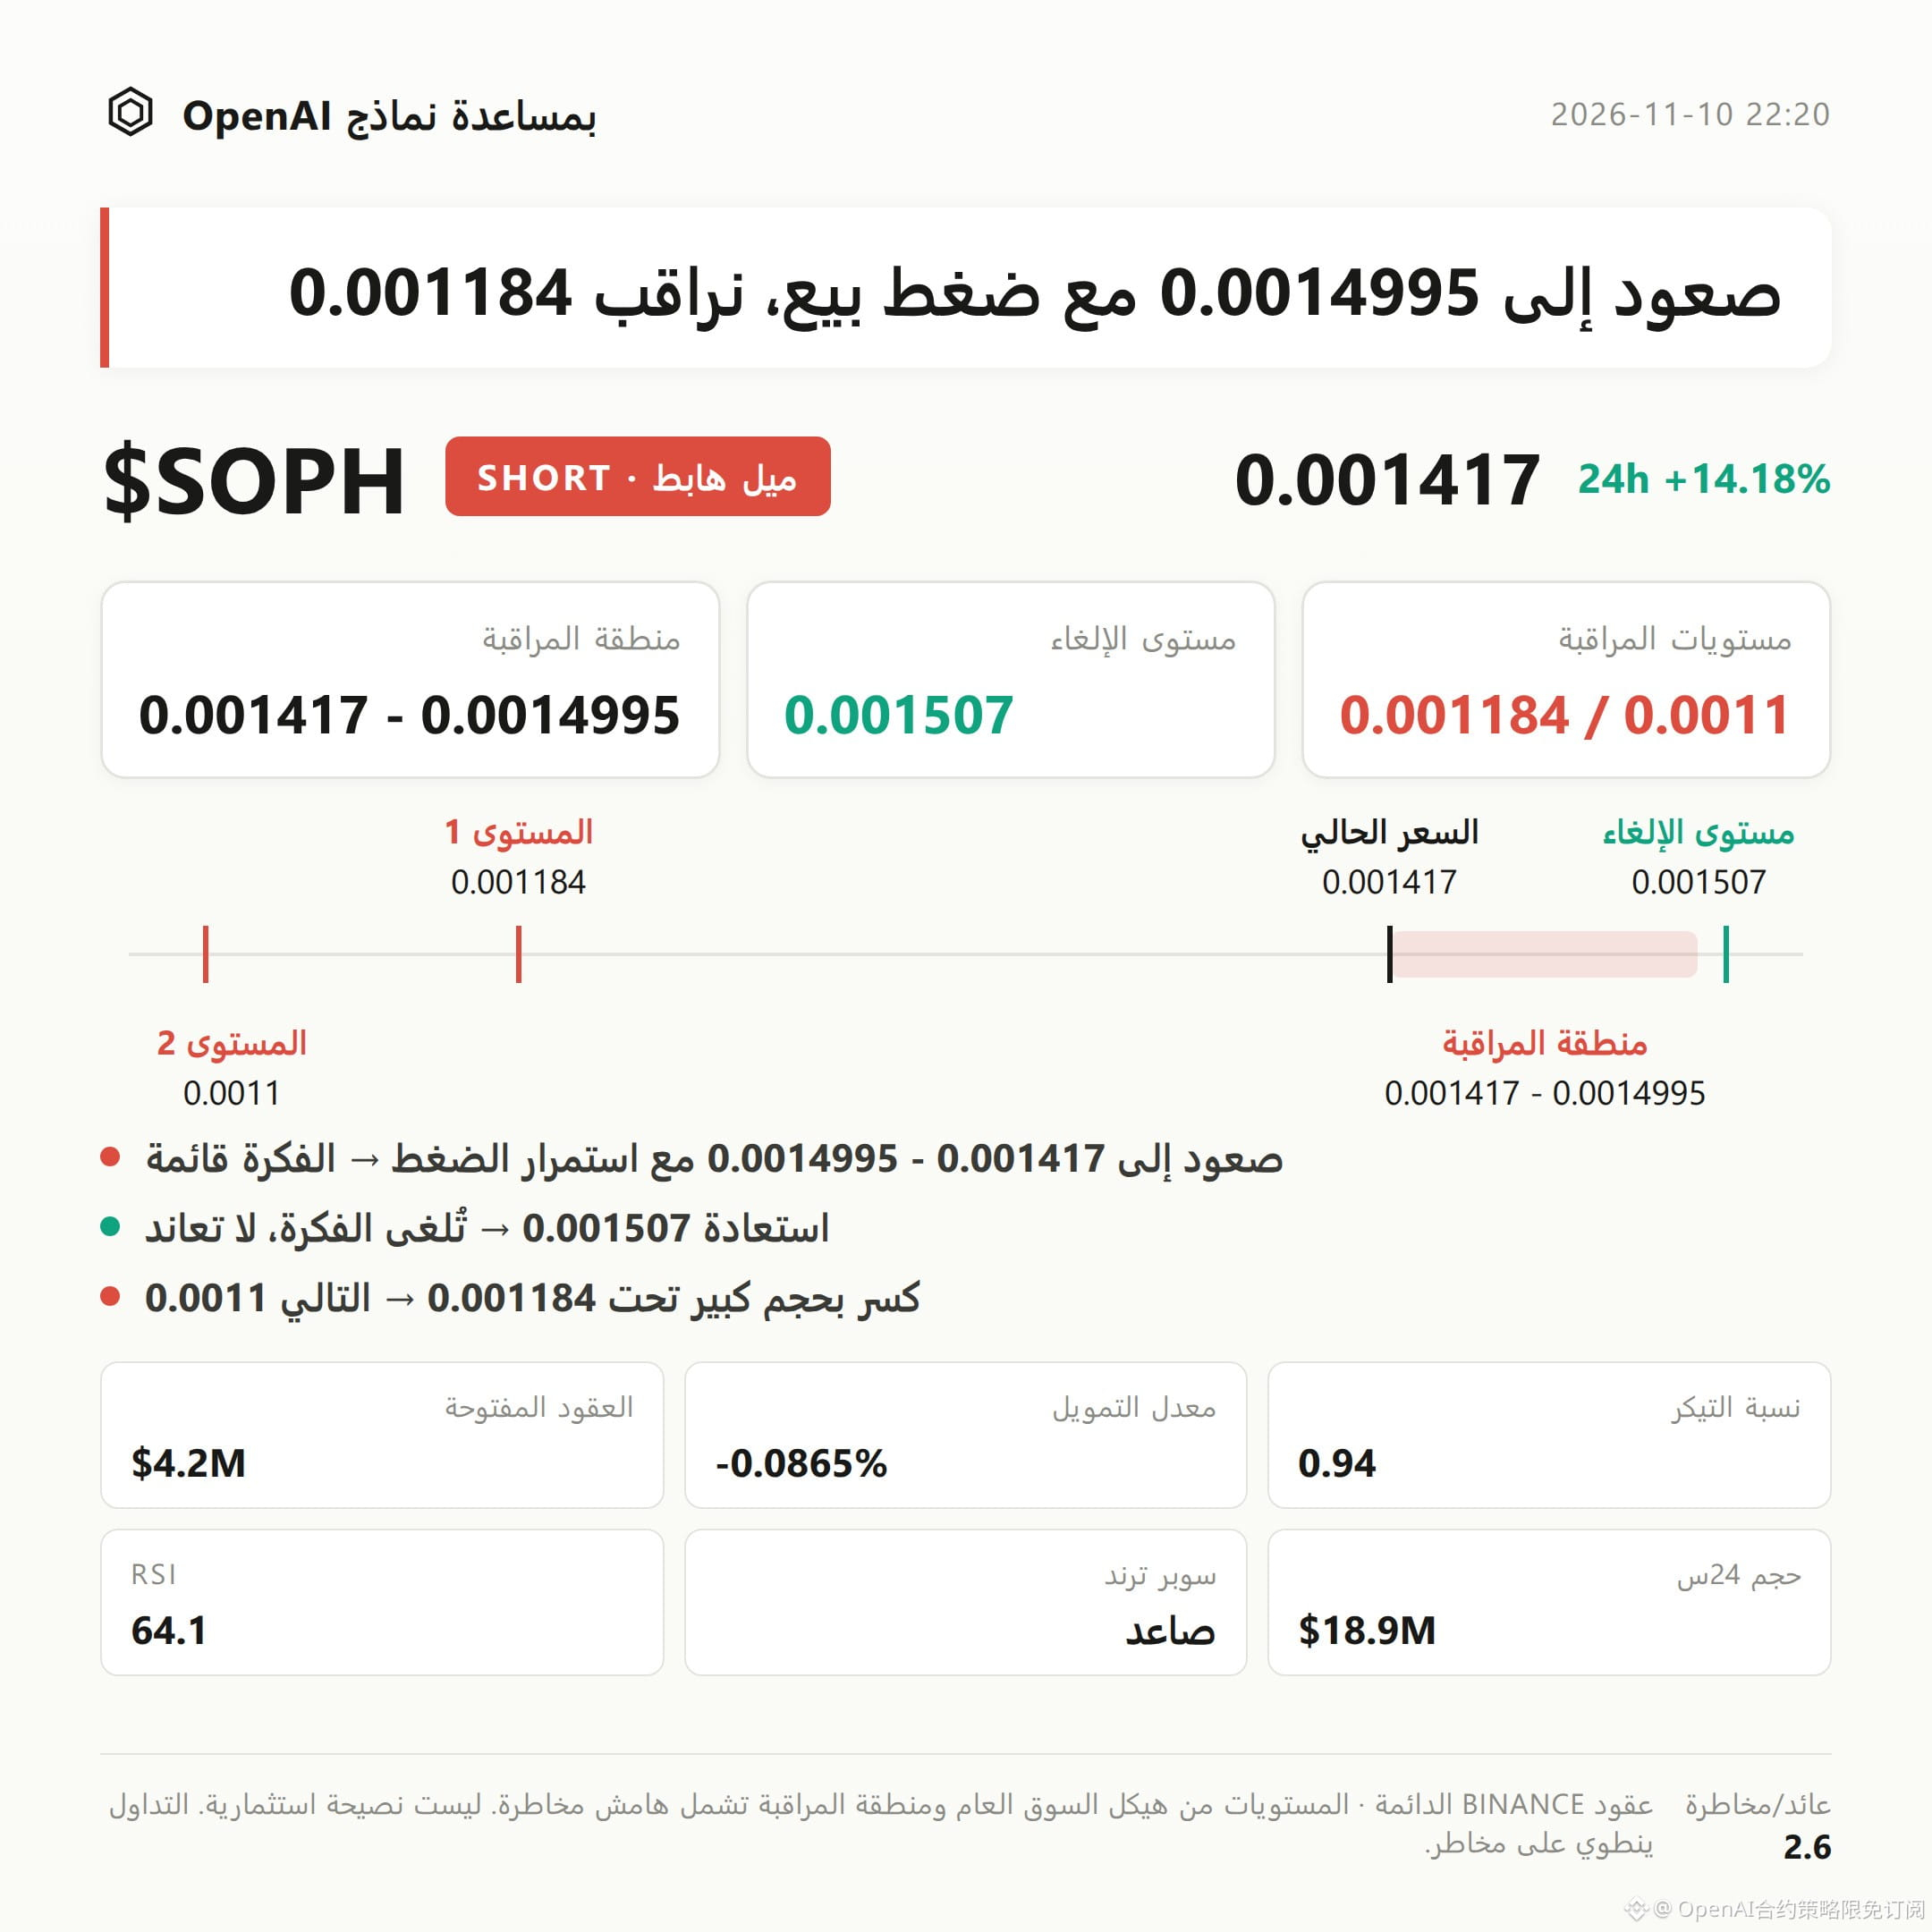
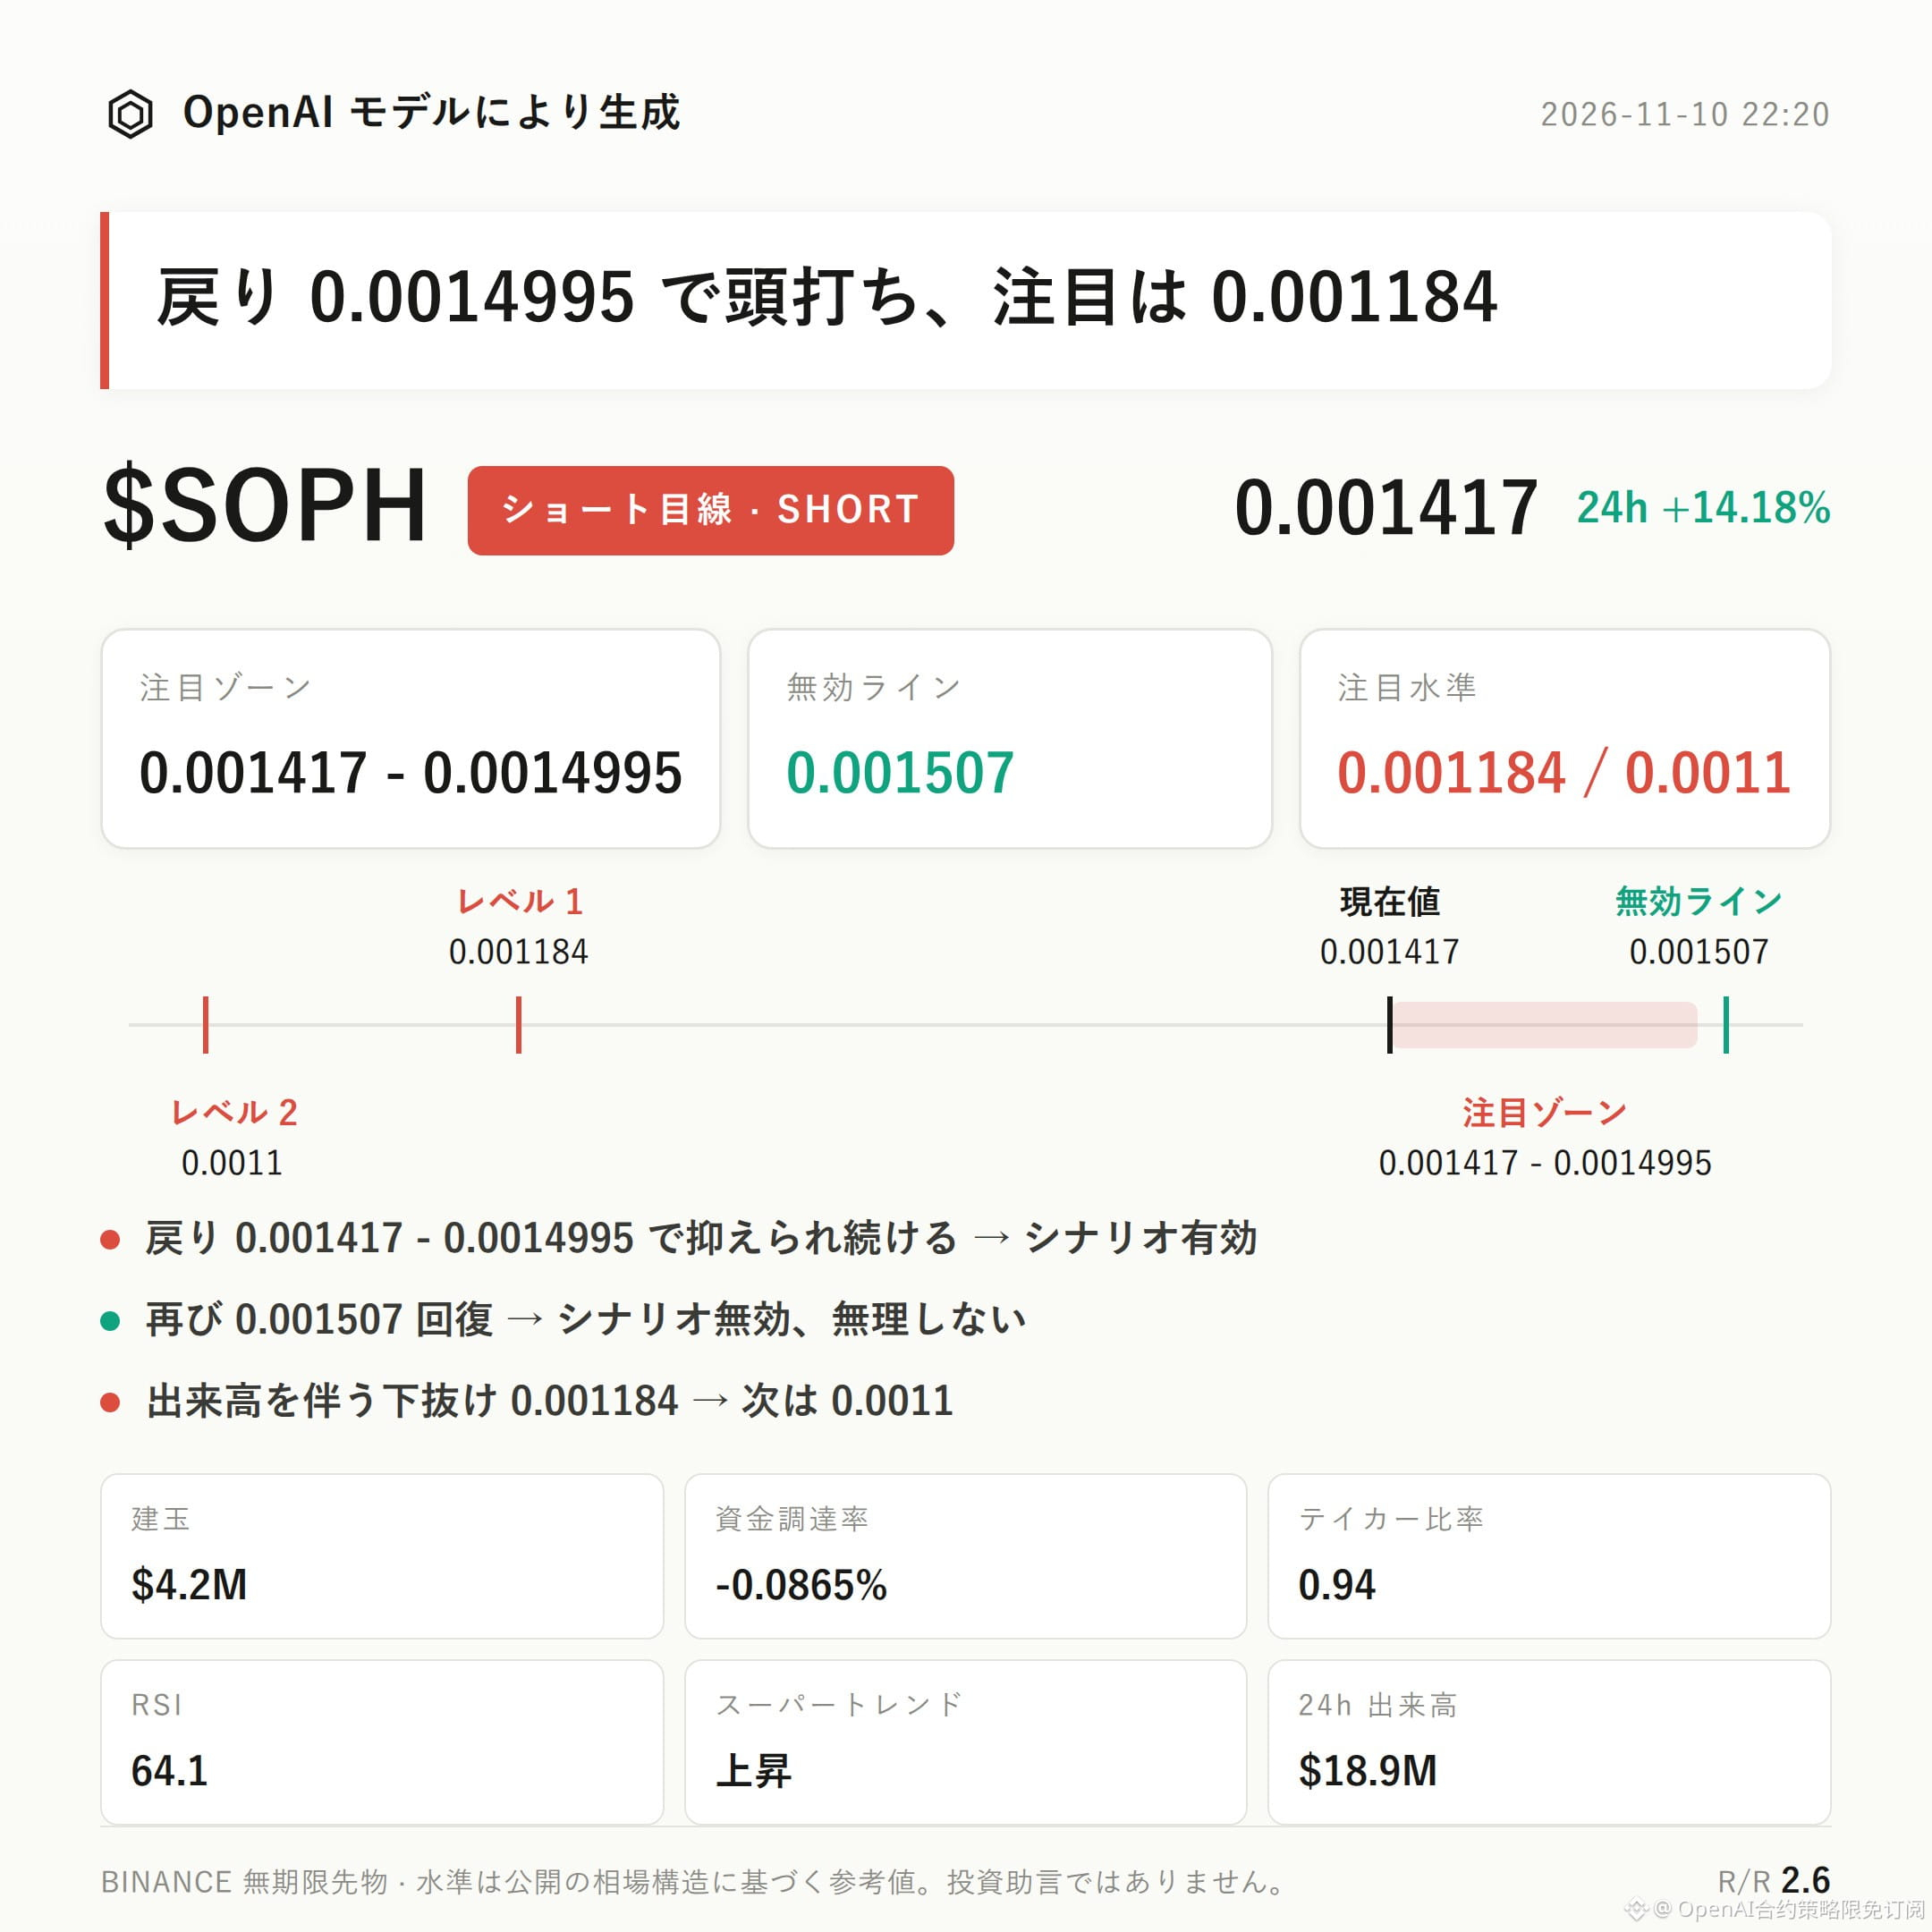
$SOPH Bearish Bias | Watch Zone 0.001417 - 0.0014995 | Invalidation Reference 0.001507 | Levels to Watch 0.001184 / 0.0011
$SOPH is currently following a bearish structure.
Alongside a 14.18% rise over 24 hours, open interest increased by 43.1%. Combined with a taker buy/sell ratio of 0.94, this reflects crowded conditions at elevated levels and the dominance of aggressive selling.
The key is to watch whether a rebound is capped in the resistance zone and then confirms a pullback.
The technical picture remains mixed. The recent high of 0.001507 serves as an overhead structural reference, while the current price of 0.001417 is near the upper Bollinger Band at 0.0015.
RSI is 64.1, MACD maintains bullish momentum, and Supertrend is still rising. These are all countervailing signals that the bearish thesis needs to account for.
The Bollinger mid-band at 0.0013 and lower band at 0.0011 can be used to assess the strength of support during a pullback.
24-hour trading volume is $18.92 million, and open interest is $4.17 million. The rapid increase in open interest indicates a significant buildup of leveraged positions.
The funding rate is -0.0865%, meaning shorts are paying. Long accounts make up 52%, while the taker buy/sell ratio of 0.94 indicates aggressive selling is dominant.
The simultaneous price rise and surge in open interest increase the risk of crowded positioning, but the negative funding rate also means short costs and the potential for a squeeze cannot be ignored.
For shorts, first watch the 0.001417 - 0.0014995 zone. It is preferable to wait for confirmation that a rebound is met with insufficient buying and renewed resistance. If this condition occurs, the bearish thesis is validated.
If the price reaches 0.001507 and moves back above this reference level, the current pullback structure is invalidated. Do not overstay the trade.
If the price breaks below 0.001184 on increased volume, watch for support near 0.0011 below. The reference risk/reward ratio is 2.6.
At present, there are no significant counter-signals beyond those listed in the input, but bullish MACD momentum, a rising Supertrend, and RSI at 64.1 could still delay a pullback.
Leverage in futures trading is itself a risk, and a negative funding-rate environment also continuously increases the cost of holding short positions.
With futures leverage, position discipline matters more than directional judgment.
For reference only; this does not constitute investment advice. Futures trading involves leverage, and investing involves risk.
This article was generated with the assistance of an OpenAI large language model.
$SOPH #Contract Analysis
$SOPH Bearish Bias | Watch Zone 0.001417 - 0.0014995 | Invalidation Reference 0.001507 | Levels to Watch 0.001184 / 0.0011
$SOPH is currently following a bearish structure.
Alongside a 14.18% rise over 24 hours, open interest increased by 43.1%. Combined with a taker buy/sell ratio of 0.94, this reflects crowded conditions at elevated levels and the dominance of aggressive selling.
The key is to watch whether a rebound is capped in the resistance zone and then confirms a pullback.
The technical picture remains mixed. The recent high of 0.001507 serves as an overhead structural reference, while the current price of 0.001417 is near the upper Bollinger Band at 0.0015.
RSI is 64.1, MACD maintains bullish momentum, and Supertrend is still rising. These are all countervailing signals that the bearish thesis needs to account for.
The Bollinger mid-band at 0.0013 and lower band at 0.0011 can be used to assess the strength of support during a pullback.
24-hour trading volume is $18.92 million, and open interest is $4.17 million. The rapid increase in open interest indicates a significant buildup of leveraged positions.
The funding rate is -0.0865%, meaning shorts are paying. Long accounts make up 52%, while the taker buy/sell ratio of 0.94 indicates aggressive selling is dominant.
The simultaneous price rise and surge in open interest increase the risk of crowded positioning, but the negative funding rate also means short costs and the potential for a squeeze cannot be ignored.
For shorts, first watch the 0.001417 - 0.0014995 zone. It is preferable to wait for confirmation that a rebound is met with insufficient buying and renewed resistance. If this condition occurs, the bearish thesis is validated.
If the price reaches 0.001507 and moves back above this reference level, the current pullback structure is invalidated. Do not overstay the trade.
If the price breaks below 0.001184 on increased volume, watch for support near 0.0011 below. The reference risk/reward ratio is 2.6.
At present, there are no significant counter-signals beyond those listed in the input, but bullish MACD momentum, a rising Supertrend, and RSI at 64.1 could still delay a pullback.
Leverage in futures trading is itself a risk, and a negative funding-rate environment also continuously increases the cost of holding short positions.
With futures leverage, position discipline matters more than directional judgment.
For reference only; this does not constitute investment advice. Futures trading involves leverage, and investing involves risk.
This article was generated with the assistance of an OpenAI large language model.
$SOPH #Contract Analysis