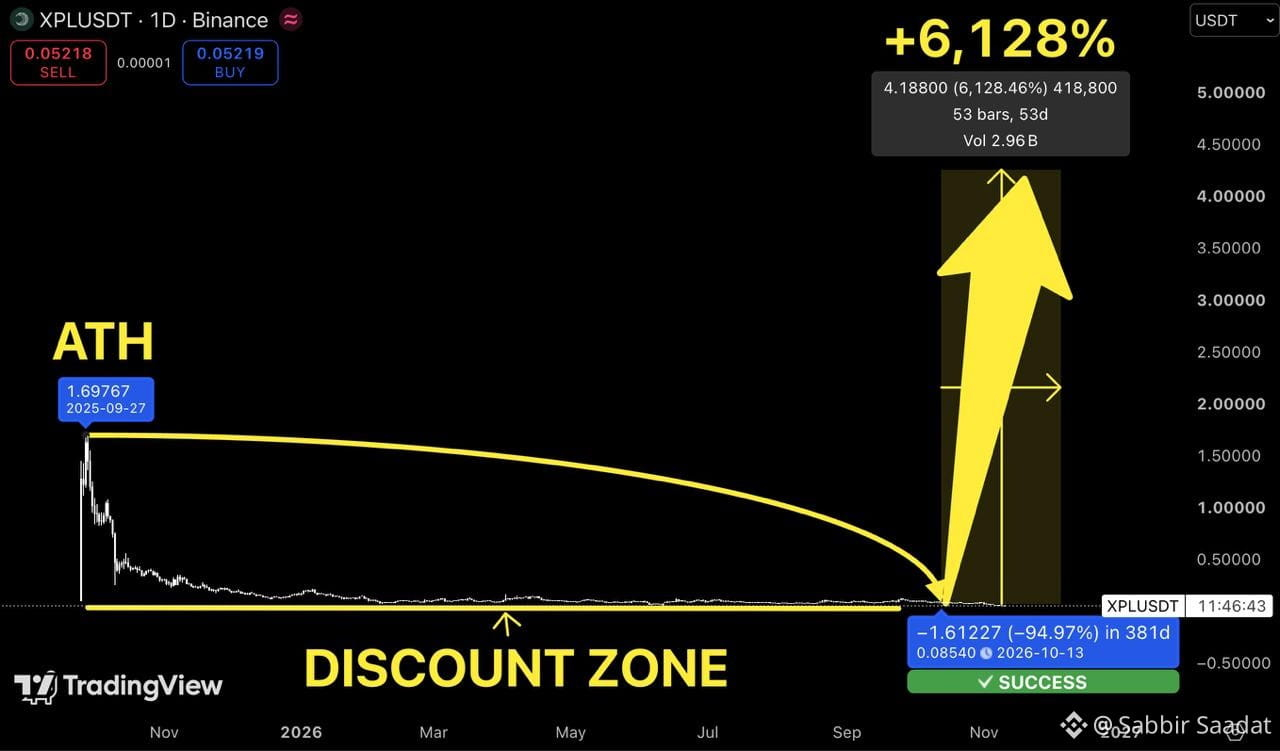

$XPL is trading around $0.052.
And this is one of the most extreme charts I've seen recently.
Back in September 2025, $XPL reached $1.69.
Since then, it's collapsed by almost 97%.
A brutal decline that has left price trading near its historical lows.
But look at the daily chart.
After months of relentless selling, $XPL is now sitting inside a major discount zone.
Volatility has compressed, and the market seems to have completely lost interest.
Could this be the beginning of a bottoming structure?
Possibly. But buyers still have a lot to prove.
Here's what I'm watching.
$0.10 — First level to reclaim.
$0.25 — Initial major resistance.
$0.50 — A potential trend reversal checkpoint.
$1.69 — Previous ATH.
And $4.25? That's my extreme bull scenario.
The chart illustrates over 6,100% potential upside from its marked historical reference point.
But don't mistake a massive upside projection for a high-probability trade.
A 97% collapse can also reflect serious fundamental weakness.
Before getting bullish, I want to see a breakout from the current range, stronger buying volume, and a clear sequence of higher lows.
Until then, XPL remains an extremely speculative recovery setup.
Still, it's fascinating how market psychology works.
At $1.69, everyone was watching.
At $0.052, almost nobody cares.
The question isn't whether XPL looks cheap.
It's whether buyers are finally ready to change the trend.
And this is one of the most extreme charts I've seen recently.
Back in September 2025, $XPL reached $1.69.
Since then, it's collapsed by almost 97%.
A brutal decline that has left price trading near its historical lows.
But look at the daily chart.
After months of relentless selling, $XPL is now sitting inside a major discount zone.
Volatility has compressed, and the market seems to have completely lost interest.
Could this be the beginning of a bottoming structure?
Possibly. But buyers still have a lot to prove.
Here's what I'm watching.
$0.10 — First level to reclaim.
$0.25 — Initial major resistance.
$0.50 — A potential trend reversal checkpoint.
$1.69 — Previous ATH.
And $4.25? That's my extreme bull scenario.
The chart illustrates over 6,100% potential upside from its marked historical reference point.
But don't mistake a massive upside projection for a high-probability trade.
A 97% collapse can also reflect serious fundamental weakness.
Before getting bullish, I want to see a breakout from the current range, stronger buying volume, and a clear sequence of higher lows.
Until then, XPL remains an extremely speculative recovery setup.
Still, it's fascinating how market psychology works.
At $1.69, everyone was watching.
At $0.052, almost nobody cares.
The question isn't whether XPL looks cheap.
It's whether buyers are finally ready to change the trend.