🚨 Bitcoin's long-term structure is getting interesting.
Look at the levels on this chart.
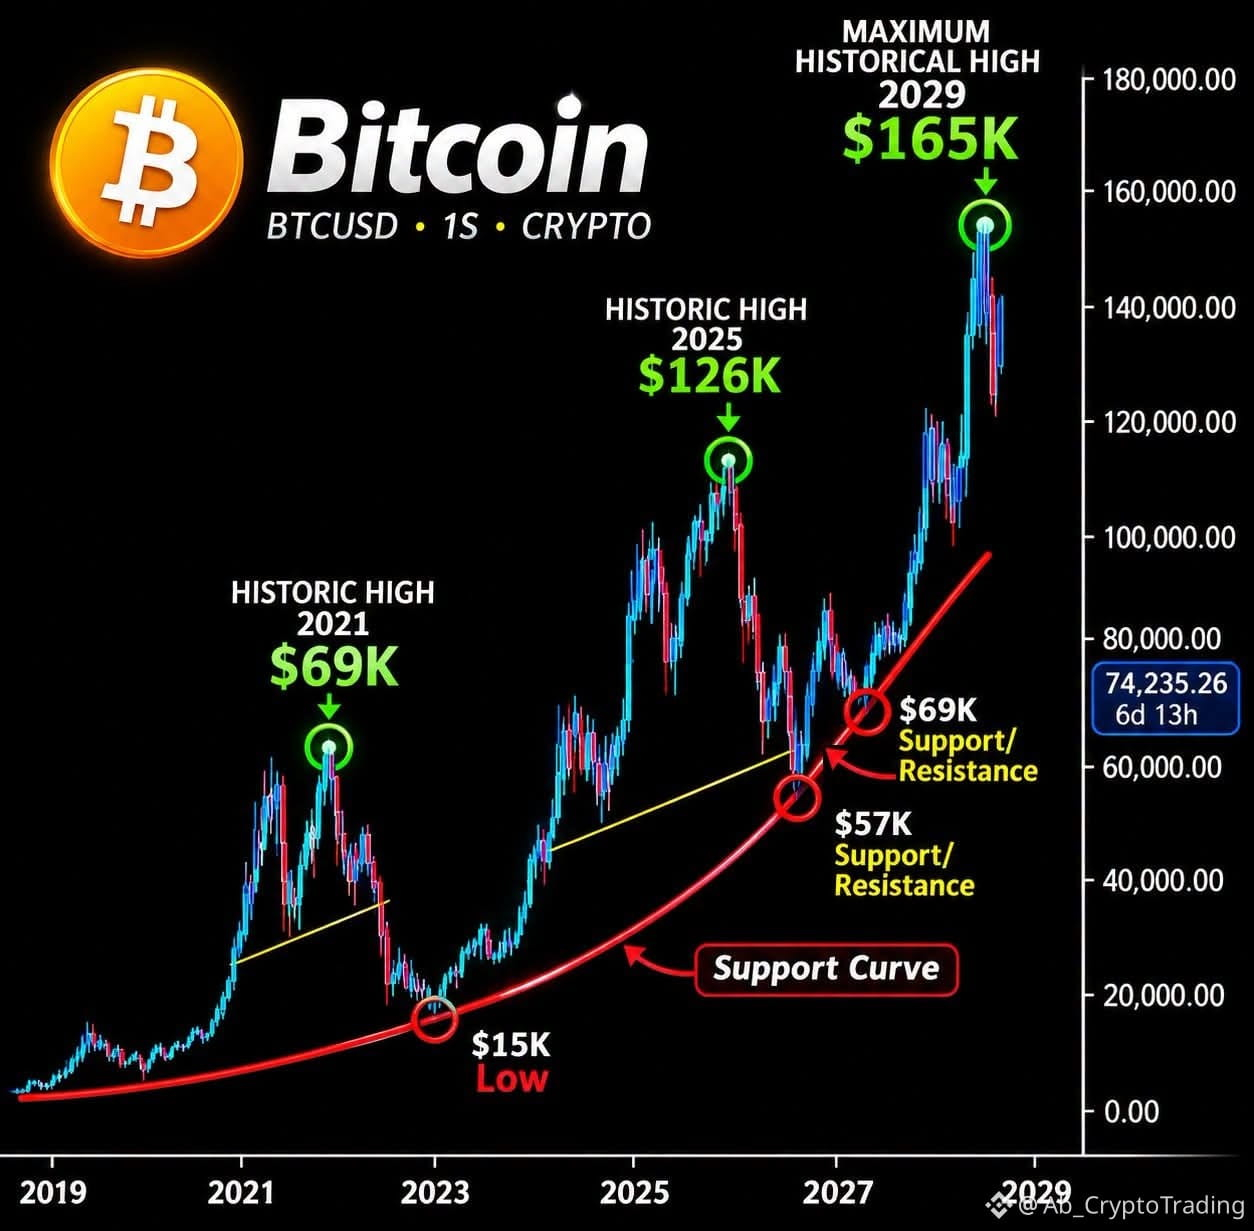
$69K was the major 2021 cycle high.
Then came the 2022–2023 correction, taking BTC down to roughly $15K.
In 2025, Bitcoin reached a new cycle high around $126K.
Now, two levels stand out: $57K and $69K.
Both are marked as potential support/resistance zones, while the long-term curve suggests a much higher structural floor over time.
And here's the scenario that caught my attention:
Could Bitcoin be building the foundation for another major expansion toward $165K by 2029?
But I wouldn't focus on the price target alone.
What matters is whether capital flows, liquidity conditions, and actual demand support that structure.
Let's settle one question:
If Bitcoin revisits the $69K area, what would you consider it?
1. A strong long-term buying opportunity.
2. A critical level that must hold to preserve the bullish structure.
3. A liquidity trap before another deeper correction.
And where do you see BTC by 2029?
$BTC $100K–$130K
$BTC $130K–$165K
$BTC $165K–$200K
#BTC Above $200K
Don't just drop a number. Explain what would drive Bitcoin there.
I'm interested in the reasoning behind the call. 👇
#bitcoin #Write2Earn #Write2Earn! #CPITestsDecemberRateOutlook
Look at the levels on this chart.
$69K was the major 2021 cycle high.
Then came the 2022–2023 correction, taking BTC down to roughly $15K.
In 2025, Bitcoin reached a new cycle high around $126K.
Now, two levels stand out: $57K and $69K.
Both are marked as potential support/resistance zones, while the long-term curve suggests a much higher structural floor over time.
And here's the scenario that caught my attention:
Could Bitcoin be building the foundation for another major expansion toward $165K by 2029?
But I wouldn't focus on the price target alone.
What matters is whether capital flows, liquidity conditions, and actual demand support that structure.
Let's settle one question:
If Bitcoin revisits the $69K area, what would you consider it?
1. A strong long-term buying opportunity.
2. A critical level that must hold to preserve the bullish structure.
3. A liquidity trap before another deeper correction.
And where do you see BTC by 2029?
$BTC $100K–$130K
$BTC $130K–$165K
$BTC $165K–$200K
#BTC Above $200K
Don't just drop a number. Explain what would drive Bitcoin there.
I'm interested in the reasoning behind the call. 👇
#bitcoin #Write2Earn #Write2Earn! #CPITestsDecemberRateOutlook