


Bitcoin dipped to $73,667 intraday before rebounding to around $75,100, but has fallen below the 50-week moving average (approximately $75,500) and lost the $77,600 True Market Mean—marking the first weekly close below that average since September 7. Derivatives liquidations totaled about $1.2 billion over the past 24 hours, with longs accounting for 90.2%; BTC-related liquidations reached $324 million, 87% of them from longs.

Why did it fall so hard?
Long leverage was concentrated around the moving average, betting that support would hold. Once it broke, cascading stop-losses kicked in, and those stops accelerated the decline—a classic self-fulfilling cycle. More importantly, liquidity is tightening: U.S. spot Bitcoin ETFs saw net outflows on four of the five trading days from November 2 to 6, totaling $1.28 billion. BlackRock's IBIT alone recorded $1.21 billion in outflows, or 94% of the total. Stablecoins shrank at the same time: USDT fell by $2.58 billion to $176.69 billion, while USDC dropped 1.83%. USDS, USD1, and BUIDL fell by more than 10%, with some funds shifting to yield-bearing stablecoins (USDe rose 9.90% and RLUSD gained 11.21%).
Historical comparisons offer some hope
Galaxy research director Alex Thorn noted that historically, there have been only two instances (2012 and 2019–2020) in which the price reclaimed the 50-week moving average after a bear-market bottom, then fell back below it. Neither time did it make a new weekly low. But the difference is significant: the rebound since the June 2026 low has been only about 26%, far below the 79% in 2019 and 223% in 2012. To confirm this is a “false breakout,” watch whether the price can reclaim the 50-week moving average in the short term.
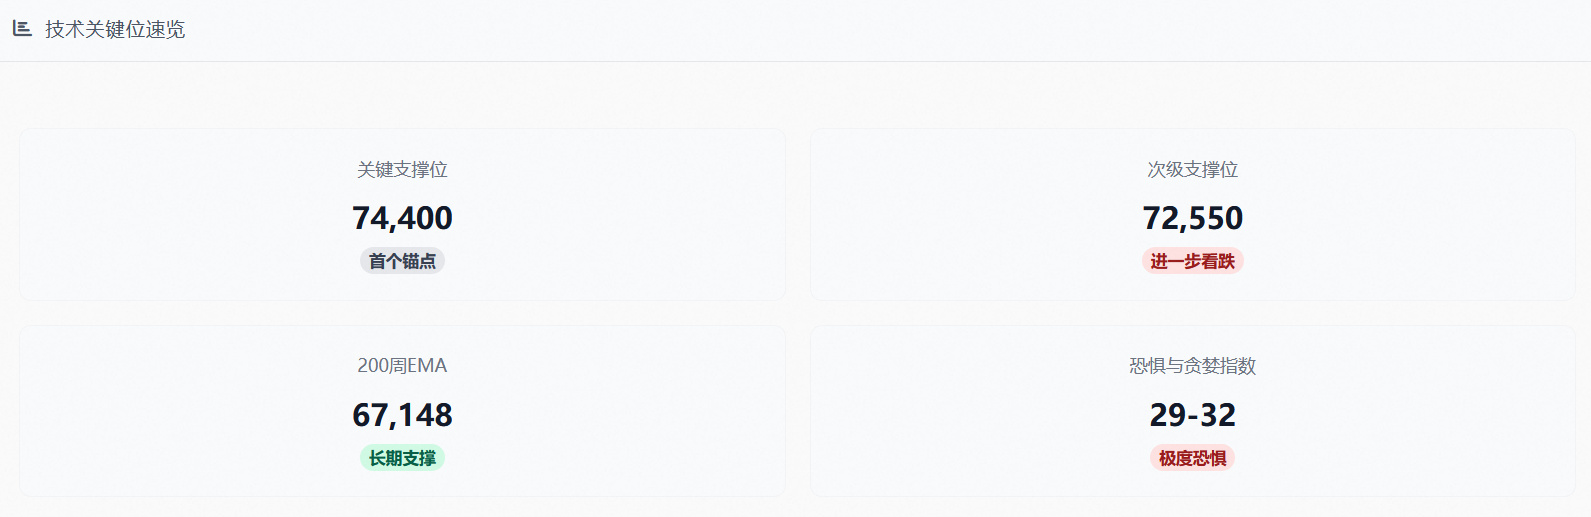
74,400 is the first key support on the weekly chart. If the price fails to close back above it on a weekly basis, the next level to watch is 72,550; a break below that points to the 67,148 area, where the 200-week EMA sits. Resistance lies at 75,600 and the 50-week moving average at 75,535.
Tonight’s CPI at 21:30
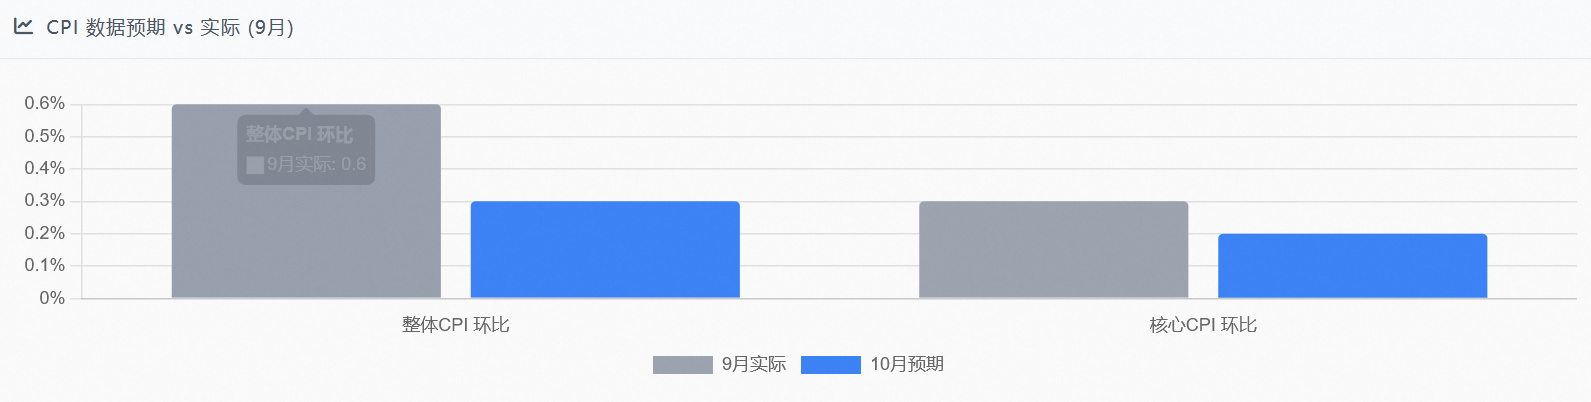
This release will report month-over-month figures only, not year-over-year figures. The market expects headline CPI to rise 0.3% and core CPI 0.2% month over month, both below September’s 0.6% and 0.3%, respectively. However, Fed Governor Waller said that even if the data improves, he still leans toward a 25-basis-point rate hike in December; if core CPI is around 0.3% month over month or higher, a 50-basis-point hike should be considered. In other words, soft data driven by short-term factors such as oil prices may not necessarily change the rate-hike path.
Sentiment and strategy
The Fear & Greed Index is at 28–32, indicating extreme fear. One positive sign is that medium-sized holders (100–1,000 BTC) have accumulated 14,207 BTC over two weeks, while whale holdings have remained stable or even edged up—suggesting a shakeout of short-term speculators. For short-term traders, the risks outweigh the opportunities: if the price falls below 74,400, avoid taking large long positions, and use strict stop-losses on smaller positions. Medium- to long-term investors can build positions in stages, while watching ETF flows and the market’s reaction to CPI. Don’t base decisions on a single technical indicator.#CPI前瞻,12月利率走向迎关键考验 #比特币连续五周下跌 #比特币现货ETF连续三日净流出2.01亿美元 #加密市场24小时清算达11.6亿美元 $BTC
