🚨 Bitcoin's biggest moves often begin when the majority gets the market completely wrong.
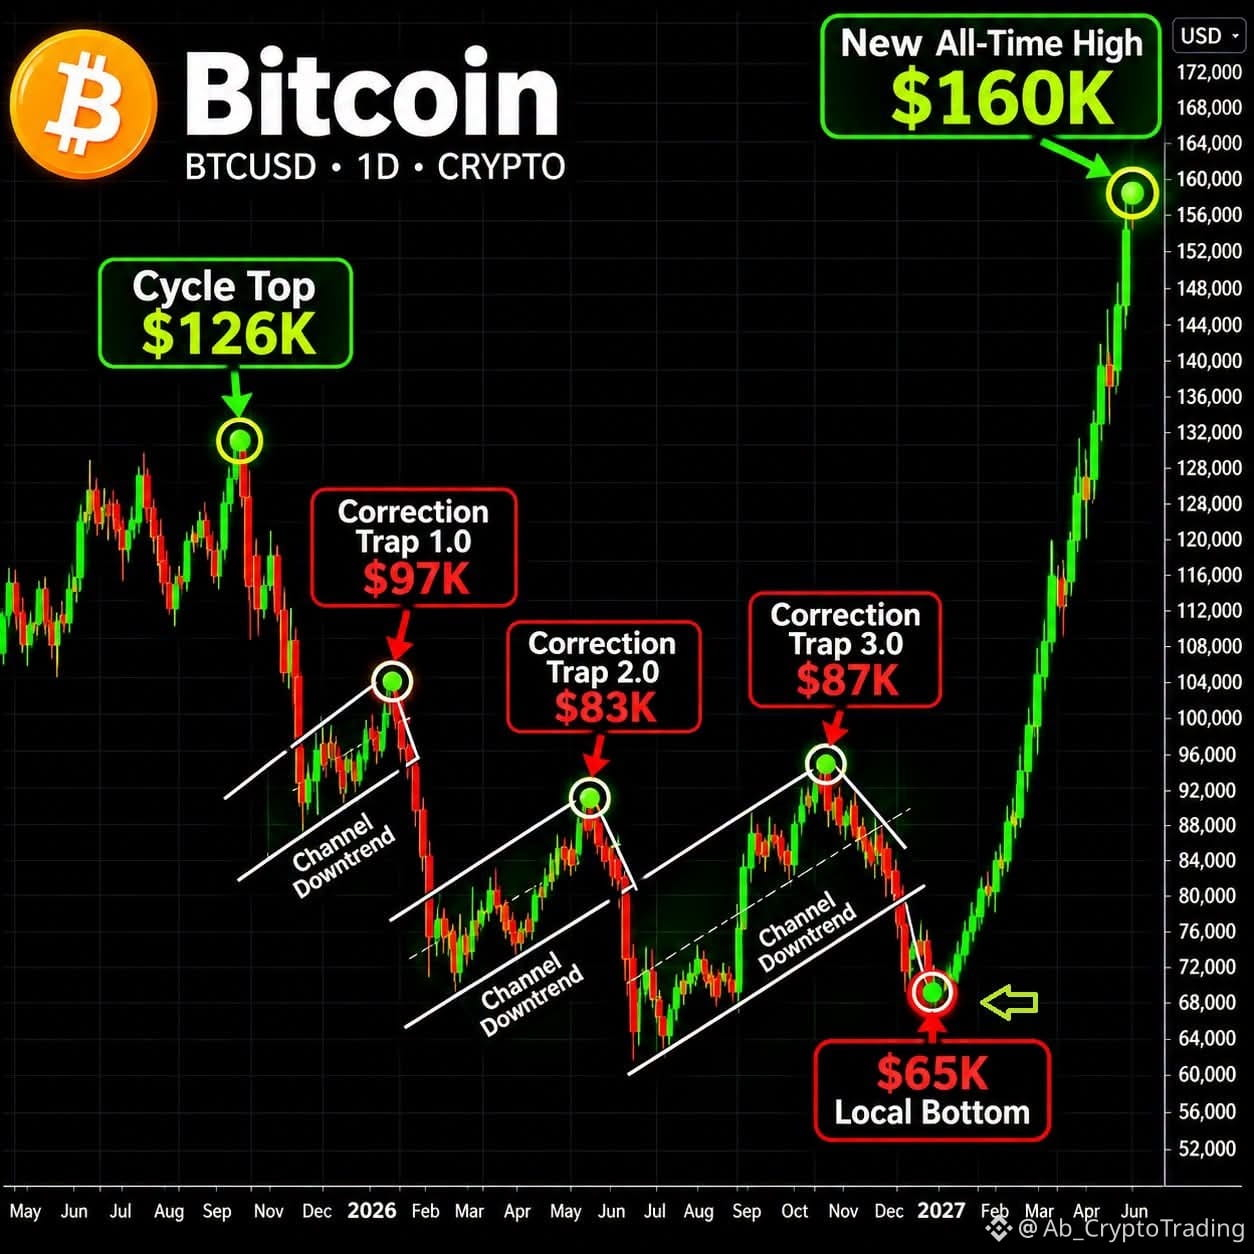
Look closely at this chart.
Three separate correction structures:
$BTC - $97K
$BTC - $83K
$BTC - $87K
Each one looked like a potential breakdown. Yet the chart's projected structure points toward a local bottom near $65K, followed by a possible expansion toward $160K.
But here's what I find more interesting than the price targets.
In a market increasingly influenced by institutional capital, ETF flows, liquidity conditions, and large-holder positioning, corrections deserve a closer look.
Is capital actually leaving Bitcoin, or is it simply changing hands?
Are long-term holders distributing into demand, while new institutional buyers absorb supply?
And are these repeated correction patterns creating liquidity for the next expansion, or are we looking at a structure that's becoming increasingly fragile?
I want to hear your actual market thesis:
If BTC drops toward $65K, would you:
1. Accumulate aggressively.
2. Wait for confirmation of a reversal.
3. Stay out until liquidity conditions improve.
4. Expect an even deeper correction.
And one final question:
Is $160K a realistic next-cycle target, or is the market pricing in too much optimism?
Don't just pick a number. Tell us what you're watching: ETF flows, exchange balances, whale activity, stablecoin liquidity, or something else.
Let's see who is actually reading the market rather than just following the candles. 👇
#BitcoinFiveWeeklyLosses #CPITestsDecemberRateOutlook #BTC
#AnthropicRejectsIPODelayValuationinQuestion
#Write2Earn
Look closely at this chart.
Three separate correction structures:
$BTC - $97K
$BTC - $83K
$BTC - $87K
Each one looked like a potential breakdown. Yet the chart's projected structure points toward a local bottom near $65K, followed by a possible expansion toward $160K.
But here's what I find more interesting than the price targets.
In a market increasingly influenced by institutional capital, ETF flows, liquidity conditions, and large-holder positioning, corrections deserve a closer look.
Is capital actually leaving Bitcoin, or is it simply changing hands?
Are long-term holders distributing into demand, while new institutional buyers absorb supply?
And are these repeated correction patterns creating liquidity for the next expansion, or are we looking at a structure that's becoming increasingly fragile?
I want to hear your actual market thesis:
If BTC drops toward $65K, would you:
1. Accumulate aggressively.
2. Wait for confirmation of a reversal.
3. Stay out until liquidity conditions improve.
4. Expect an even deeper correction.
And one final question:
Is $160K a realistic next-cycle target, or is the market pricing in too much optimism?
Don't just pick a number. Tell us what you're watching: ETF flows, exchange balances, whale activity, stablecoin liquidity, or something else.
Let's see who is actually reading the market rather than just following the candles. 👇
#BitcoinFiveWeeklyLosses #CPITestsDecemberRateOutlook #BTC
#AnthropicRejectsIPODelayValuationinQuestion
#Write2Earn