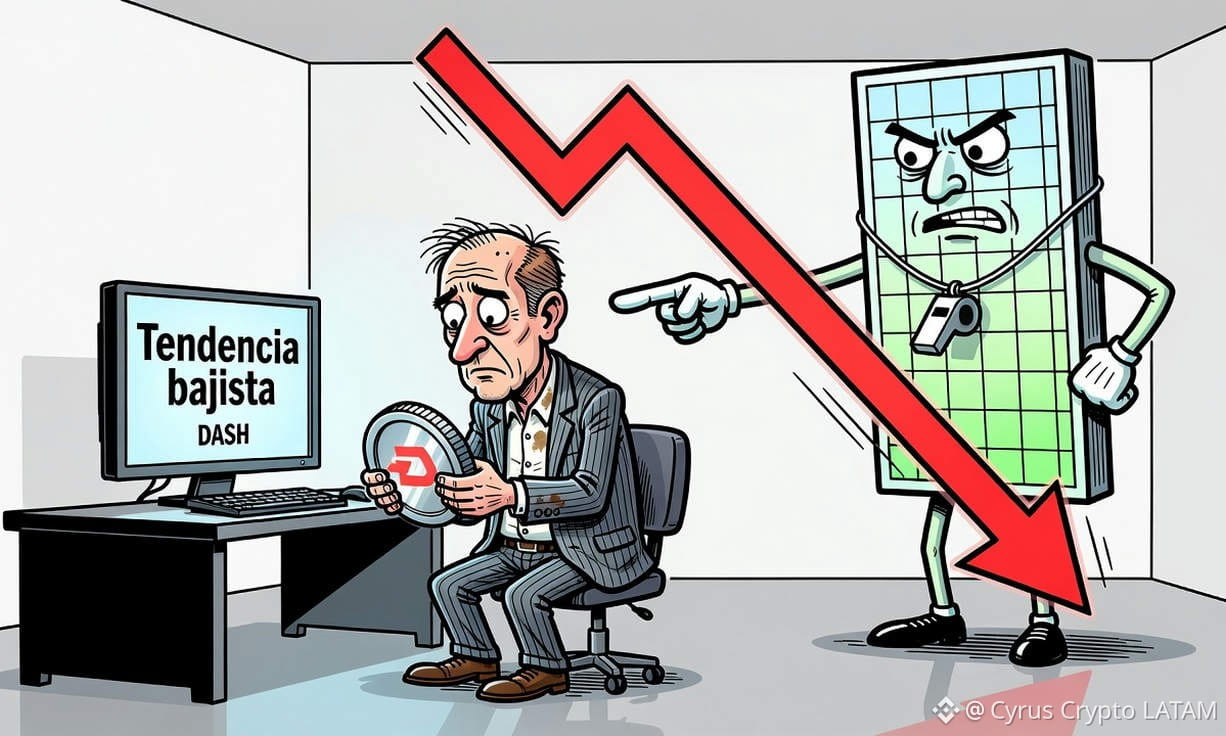
$DASH loses momentum and falls below its key averages on November 10
#DASH trades at USD $45.81, with a reported daily decline of 1.70% and volume below its 30-day average. The price remains above its SMA-200, but below the short- and medium-term averages, while the RSI and MACD reflect weak momentum; the lack of data on derivatives, on-chain activity, and confirmed catalysts limits confidence in any directional thesis.
However, comparison with the previous close of USD $46.08 shows a smaller decline of approximately 0.59%; this inconsistency makes it impossible to attribute uniform accuracy to the daily percentage and should be verified before placing orders based on the percentage change.
Dash is presented as a protocol asset, but the data provided do not describe its current use, monetization, number of users, payment activity, system revenue, or security or governance metrics. There are also no figures for circulating or total supply, so dilution, future inflation, or per-unit valuation against a known supply baseline cannot be estimated.
Recommendation: HOLD. The methodology uses five observable signals: trend relative to moving averages, RSI, MACD, relative volume, and position relative to the SMA-200. Three of the five favor caution—price below the short-term averages, RSI below 50, and bearish MACD—while low volume does not confirm a high-conviction sell-off, and the price above the SMA-200 provides partial support.
Short term: a conditional strategy could wait for a recovery to USD $46.08–USD $46.70 before opening tactical exposure, with partial profit-taking near USD $48.01 and USD $48.36, levels derived from the Fibonacci reference and the SMA-15. If trading the support, the low of USD $45.43 is an immediate invalidation reference; the stop-loss should be adjusted to the USD $3.20 ATR and the accepted risk, rather than mechanically set at the same price for everyone.
#DASH trades at USD $45.81, with a reported daily decline of 1.70% and volume below its 30-day average. The price remains above its SMA-200, but below the short- and medium-term averages, while the RSI and MACD reflect weak momentum; the lack of data on derivatives, on-chain activity, and confirmed catalysts limits confidence in any directional thesis.
However, comparison with the previous close of USD $46.08 shows a smaller decline of approximately 0.59%; this inconsistency makes it impossible to attribute uniform accuracy to the daily percentage and should be verified before placing orders based on the percentage change.
Dash is presented as a protocol asset, but the data provided do not describe its current use, monetization, number of users, payment activity, system revenue, or security or governance metrics. There are also no figures for circulating or total supply, so dilution, future inflation, or per-unit valuation against a known supply baseline cannot be estimated.
Recommendation: HOLD. The methodology uses five observable signals: trend relative to moving averages, RSI, MACD, relative volume, and position relative to the SMA-200. Three of the five favor caution—price below the short-term averages, RSI below 50, and bearish MACD—while low volume does not confirm a high-conviction sell-off, and the price above the SMA-200 provides partial support.
Short term: a conditional strategy could wait for a recovery to USD $46.08–USD $46.70 before opening tactical exposure, with partial profit-taking near USD $48.01 and USD $48.36, levels derived from the Fibonacci reference and the SMA-15. If trading the support, the low of USD $45.43 is an immediate invalidation reference; the stop-loss should be adjusted to the USD $3.20 ATR and the accepted risk, rather than mechanically set at the same price for everyone.