ZEC Nears Critical Support: Is a Bounce Coming?
Recent $ZEC USDT price action suggests that a potential recovery could be developing, as ZEC approaches an important support area where buyers may start showing renewed interest.
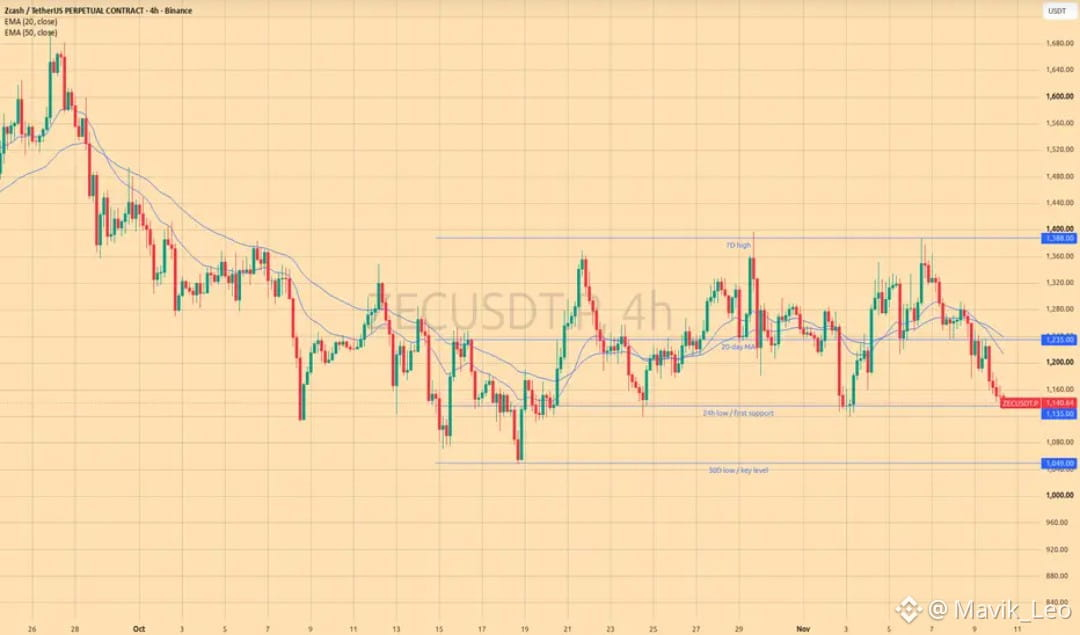
After reaching a local high near $1,388, ZEC has experienced a sharp correction and is now trading around $1,150. Price has slipped below its short-term moving averages, putting pressure on the bullish structure.
However, I don't think the bigger picture should be ignored.
The first important support area I'm watching is $1,135–$1,116. This zone could become a potential reaction area if buyers step in with enough strength.
The 4H RSI is around 34, while daily RSI is approximately 44. This shows that short-term momentum is heavily weakened, although an oversold RSI alone does not confirm a reversal. �
ClosedCandle +1
Key Levels I'm Watching
If ZEC manages to defend support and recover its momentum, these are my upside levels:
$1,180 — First resistance.
$1,198 — Important recovery level.
$1,235–$1,241 — Major resistance and moving-average region.
$1,290 — Next upside objective.
$1,388 — Previous local high.
A sustained reclaim of $1,198, followed by a successful retest, would make me more confident about a larger recovery.
Fibonacci & EMA Structure
The recent decline has pushed ZEC below its short-term EMA structure.
The $1,200–$1,235 region is particularly important because reclaiming it would indicate that buyers are gradually regaining control.
I also want to see stronger volume accompanying any breakout rather than relying on a temporary bounce.
Risk Management
The main support I'm watching remains $1,135–$1,116.
If price loses this region with a convincing daily close, the next major downside area could be around $1,049.
A daily close below $1,049 would seriously weaken my recovery outlook.
My Final Thoughts
I'm interested in how ZEC reacts inside this support region.
$INIT $ARIA
Recent $ZEC USDT price action suggests that a potential recovery could be developing, as ZEC approaches an important support area where buyers may start showing renewed interest.
After reaching a local high near $1,388, ZEC has experienced a sharp correction and is now trading around $1,150. Price has slipped below its short-term moving averages, putting pressure on the bullish structure.
However, I don't think the bigger picture should be ignored.
The first important support area I'm watching is $1,135–$1,116. This zone could become a potential reaction area if buyers step in with enough strength.
The 4H RSI is around 34, while daily RSI is approximately 44. This shows that short-term momentum is heavily weakened, although an oversold RSI alone does not confirm a reversal. �
ClosedCandle +1
Key Levels I'm Watching
If ZEC manages to defend support and recover its momentum, these are my upside levels:
$1,180 — First resistance.
$1,198 — Important recovery level.
$1,235–$1,241 — Major resistance and moving-average region.
$1,290 — Next upside objective.
$1,388 — Previous local high.
A sustained reclaim of $1,198, followed by a successful retest, would make me more confident about a larger recovery.
Fibonacci & EMA Structure
The recent decline has pushed ZEC below its short-term EMA structure.
The $1,200–$1,235 region is particularly important because reclaiming it would indicate that buyers are gradually regaining control.
I also want to see stronger volume accompanying any breakout rather than relying on a temporary bounce.
Risk Management
The main support I'm watching remains $1,135–$1,116.
If price loses this region with a convincing daily close, the next major downside area could be around $1,049.
A daily close below $1,049 would seriously weaken my recovery outlook.
My Final Thoughts
I'm interested in how ZEC reacts inside this support region.
$INIT $ARIA