$INIT
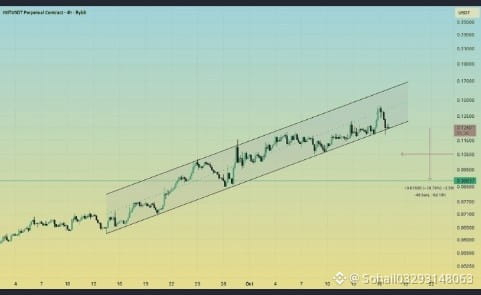
The image shows an ascending (rising) parallel channel on a price chart (such as a cryptocurrency perpetual contract like INITUSDT or a similar asset on TradingView), illustrating a series of higher highs and higher lows moving within an upward trendline and resistance channel.
Key Technical Observations
Channel Structure: The price is moving within a well-defined parallel upward channel, demonstrating bullish progression over the shown timeframe.
Current Position: The price appears to be testing or nearing the upper boundary/resistance of the channel, or experiencing a minor pullback toward the middle/support area.
Key Levels to Watch:
Support: The lower trendline of the channel or prior horizontal swing lows act as dynamic support.
Resistance: The upper parallel trendline where selling pressure or profit-taking often occurs.
Breakout / Breakdown Risk: A clean break above the upper channel resistance could signal a continuation or acceleration of the uptrend, whereas a drop below the lower channel support would indicate a trend reversal or deeper correction.
#AIChipSlumpNasdaq
#BitcoinFiveWeeklyLosses
#US-IranTalksFuelStrongStockMarketRebound
#CanNvidiaEarningsEaseMarketConcerns?
The image shows an ascending (rising) parallel channel on a price chart (such as a cryptocurrency perpetual contract like INITUSDT or a similar asset on TradingView), illustrating a series of higher highs and higher lows moving within an upward trendline and resistance channel.
Key Technical Observations
Channel Structure: The price is moving within a well-defined parallel upward channel, demonstrating bullish progression over the shown timeframe.
Current Position: The price appears to be testing or nearing the upper boundary/resistance of the channel, or experiencing a minor pullback toward the middle/support area.
Key Levels to Watch:
Support: The lower trendline of the channel or prior horizontal swing lows act as dynamic support.
Resistance: The upper parallel trendline where selling pressure or profit-taking often occurs.
Breakout / Breakdown Risk: A clean break above the upper channel resistance could signal a continuation or acceleration of the uptrend, whereas a drop below the lower channel support would indicate a trend reversal or deeper correction.
#AIChipSlumpNasdaq
#BitcoinFiveWeeklyLosses
#US-IranTalksFuelStrongStockMarketRebound
#CanNvidiaEarningsEaseMarketConcerns?