

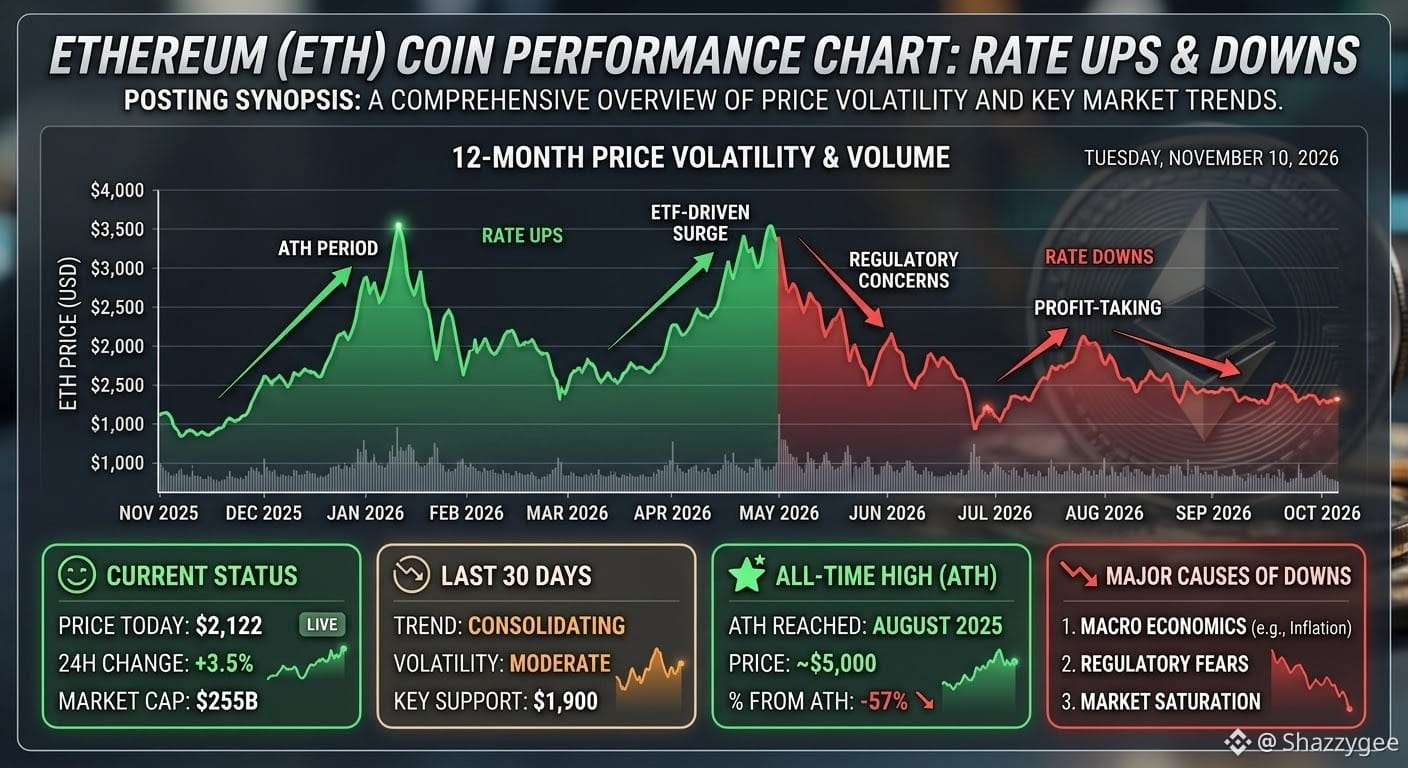
This chart illustrates Ethereum's ($ETH ) price volatility over a hypothetical 12-month period, highlighting key periods of significant price surges and downward trends based on market events and sentiment. It breaks down the current status, recent performance, and all-time high data, providing a snapshot of the asset's market standing. Additionally, the overview categorizes major factors that traditionally influence dips, such as regulatory concerns and profit-taking phases.#CPITestsDecemberRateOutlook #BitcoinFiveWeeklyLosses
Join global crypto users on Binance Square
⚡️ Get latest and useful information about crypto.
💬 Trusted by the world’s largest crypto exchange.
👍 Discover real insights from verified creators.
Email / Phone number