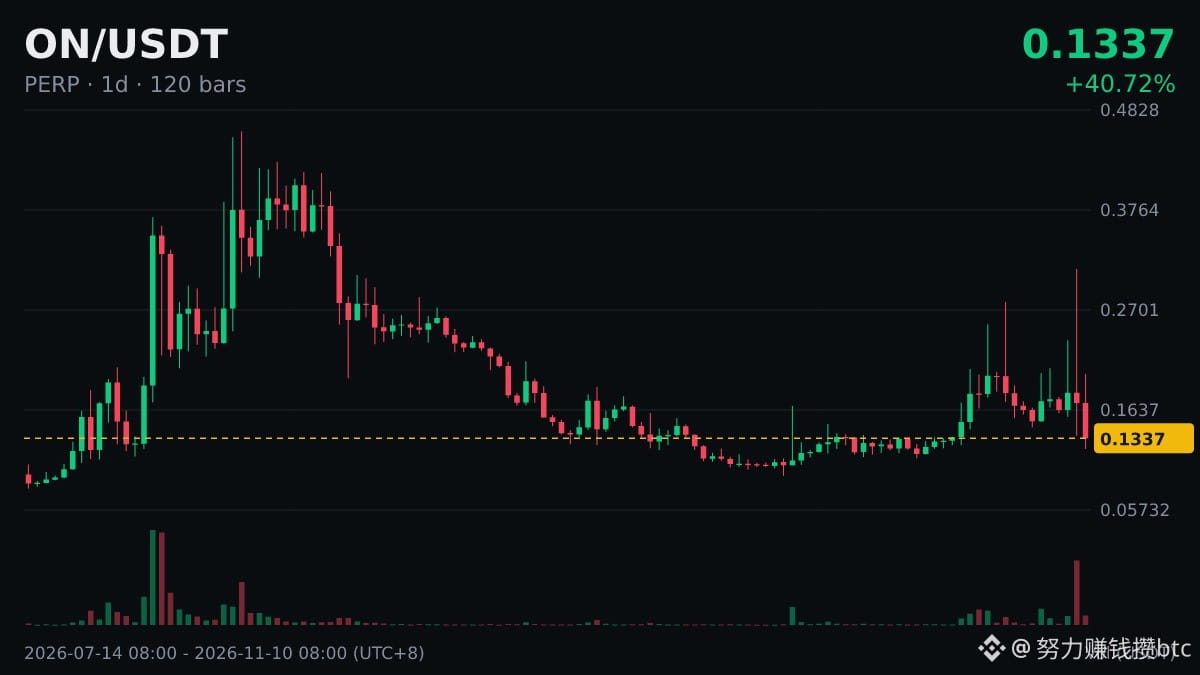
$ON ’s daily candle has fallen below MA50 (0.1371), down 49.87% in 24h.
Let’s use this figure to talk about moving averages.
Longer-term moving averages like MA200 are widely watched, partly because so many people watch them. When the price approaches one, volatility often becomes more pronounced.
An intraday move across the average and confirmation at the daily close are two different things: the signal is more meaningful if the price remains on that side of the average after the close.
Working out your position size based on where you’ll place your stop-loss is far more reliable than going by gut feeling.
Let’s use this figure to talk about moving averages.
Longer-term moving averages like MA200 are widely watched, partly because so many people watch them. When the price approaches one, volatility often becomes more pronounced.
An intraday move across the average and confirmation at the daily close are two different things: the signal is more meaningful if the price remains on that side of the average after the close.
Working out your position size based on where you’ll place your stop-loss is far more reliable than going by gut feeling.