


It stands at a critical inflection point, but not in a positive sense. This is not merely a price decline, but a complete decoupling between traditional risk appetite (stocks) and crypto, driven by ongoing institutional outflows through #ETF funds, dangerous long positioning in derivatives, and anticipation of an inflation event (#CPI ) that could determine the fate of US monetary policy.
🔻 First: The big picture — “Stocks are celebrating, while crypto is bleeding”
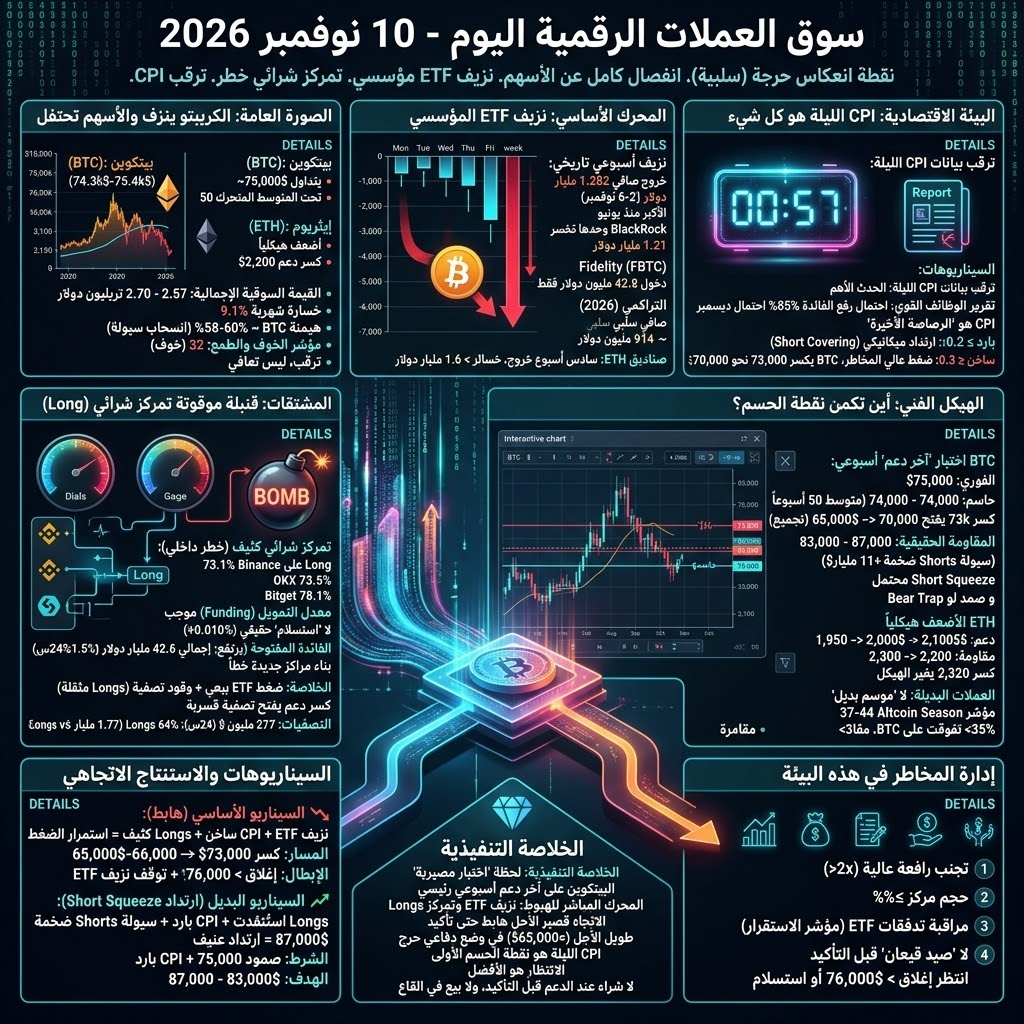
· Bitcoin (BTC): Trading at **~$75,000** (fluctuating between $74,300 and $75,400), after touching its lowest level since September 21. The price remains below the 50-week moving average, a major technical support level that was recently broken.
· Ethereum (ETH): **~$2,130**, structurally weaker than BTC after breaking below $2,200 support.
· Total market capitalization: Fell to $2.57 - $2.70 trillion, down 9.1% for the month, with BTC dominance at ~58-60%. This means liquidity is not rotating into altcoins but is leaving the market as a whole.
· Fear and Greed Index: At 32 (Fear), up slightly from 29, but still far from neutral (50), reflecting a state of uncertainty rather than recovery.
🚨 Second: The main driver — “ETF outflows” are choking off any recovery
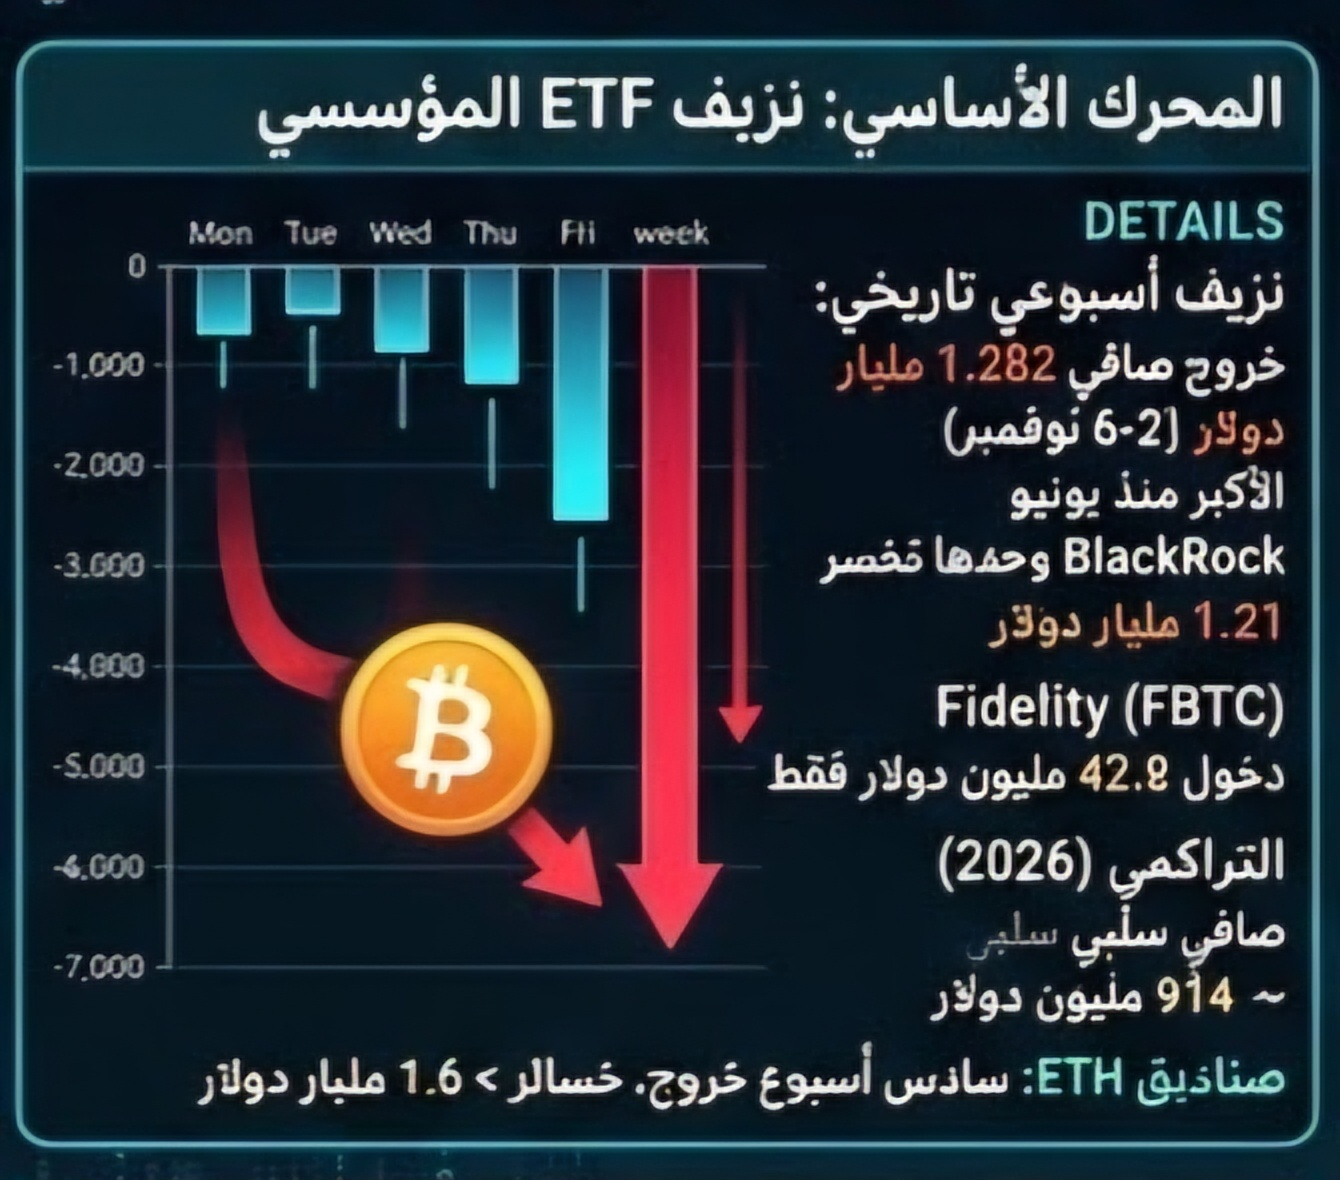
The most direct reason for the market’s weakness is the near-total halt in institutional demand through exchange-traded funds:
· A historic week of outflows: U.S. spot BTC ETFs recorded net outflows of $1.282 billion between November 2 and 6, their largest weekly outflow since June and the seventh-largest since launch.
· BlackRock alone lost $1.21 billion: The IBIT fund accounted for most of the outflows, while Fidelity’s FBTC recorded just $42.8 million in inflows—not enough to offset the losses.
· Cumulative impact: 2026 flows into spot BTC ETFs turned net negative at ~$914 million, wiping out nearly a full year of gains. ETH ETFs recorded their sixth consecutive week of outflows, with losses exceeding $1.6 billion.
· Why does this matter? In 2024-2025, these funds were the “marginal buyer” driving prices higher. Their absence means the market lacks new buying power capable of absorbing selling, explaining why BTC has failed to catch up with the stock market rebound.
🏦 Third: The macroeconomic environment — “Tonight’s CPI is everything”
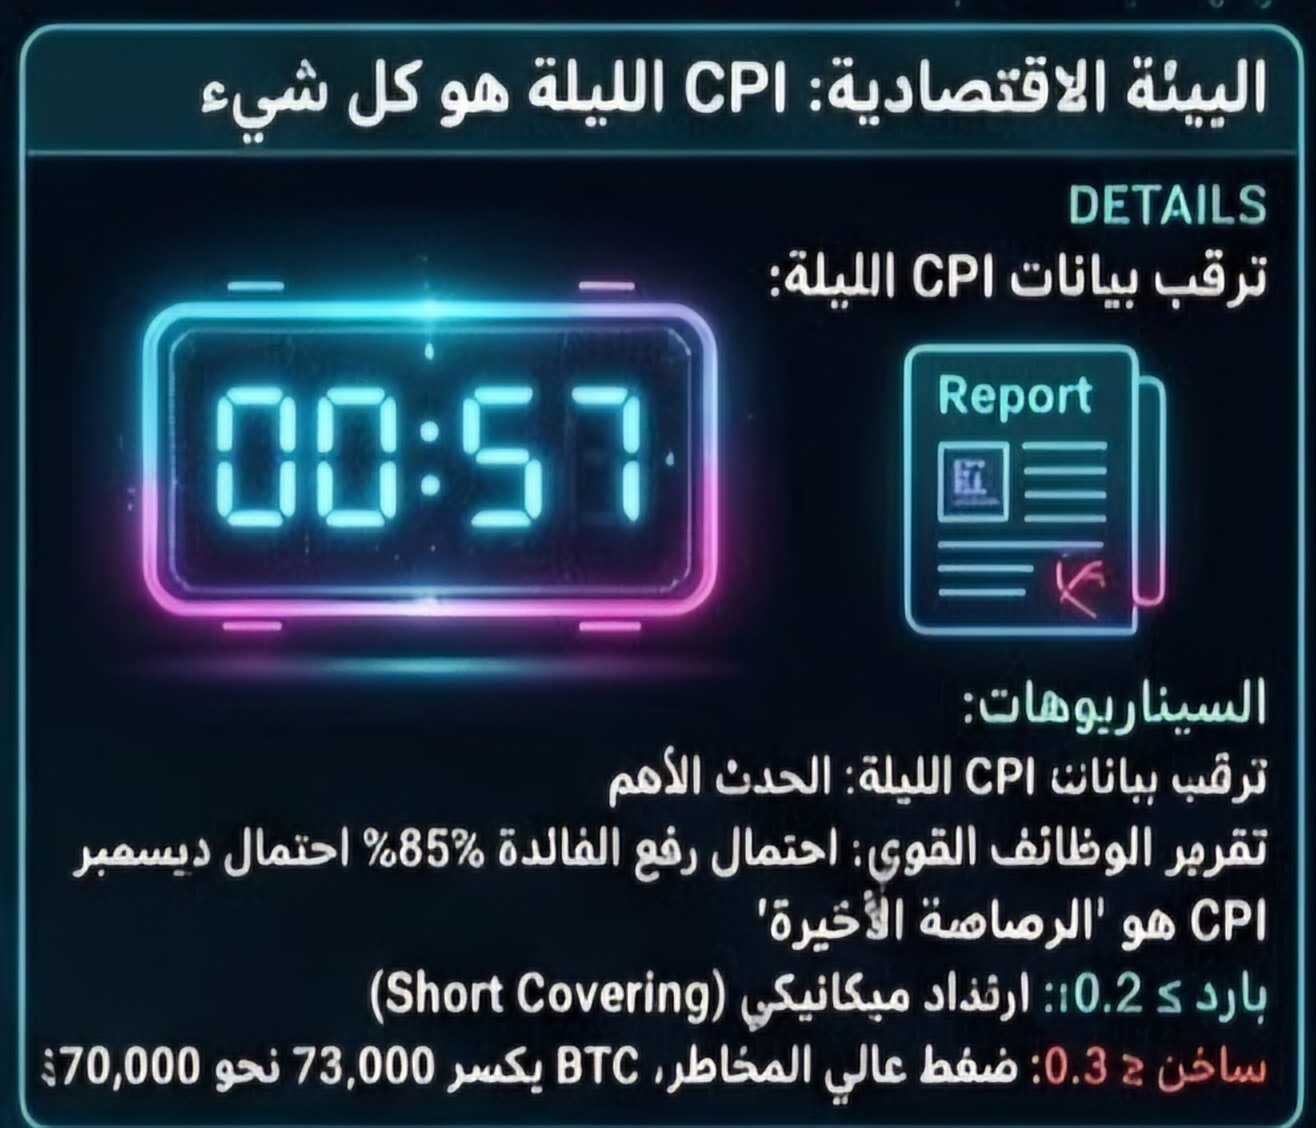
The market is awaiting the October CPI inflation data scheduled for release tonight, the most important event of the week:
· Background: The strong jobs report (165,000 jobs in October) led the market to reprice the likelihood of a December rate hike, with current expectations ranging from 80% to 85%.
· Why is CPI more important than jobs? Because strong employment alone was not enough to confirm a rate hike. CPI is the “final bullet” that could give the Fed the green light or halt tightening.
· Scenarios:
· Cool CPI (≤ 0.2% monthly core): Could give the market a reason for a mechanical rebound (Short Covering), but won’t be enough on its own to reverse the trend as long as ETF outflows continue.
· Hot CPI (≥ 0.3% or 3.9% annually): Will reinforce rate-hike expectations, putting pressure on risk assets. BTC could quickly break below **$73,000** toward **$70,000**
· Additional factor: PPI data and AI company earnings later in the week could add to volatility in traditional assets, with potential spillover into crypto.
⚖️ Fourth: Derivatives — a “ticking time bomb” of crowded Long positions
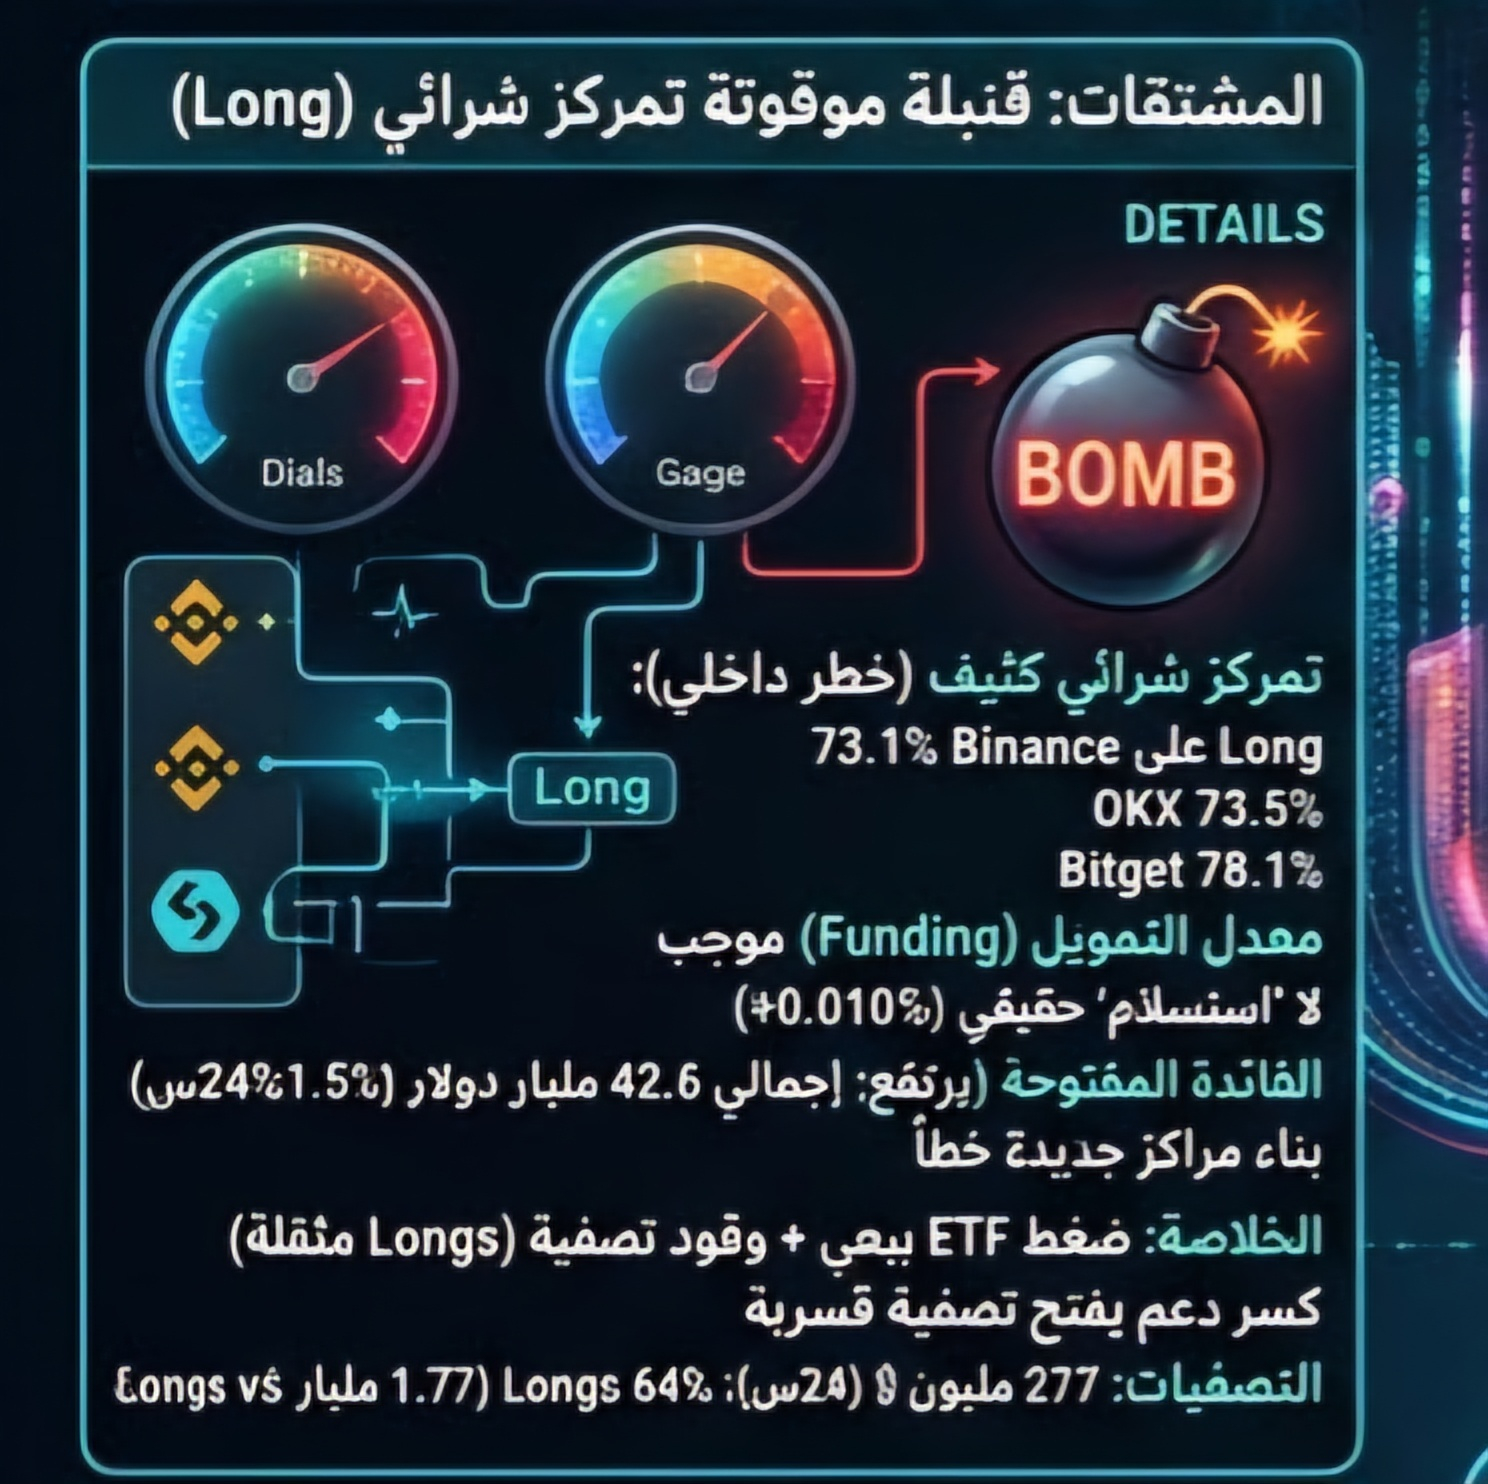
This is the most dangerous internal factor, and best explains why any sharp decline can turn into a liquidation cascade:
· Long positioning is extremely crowded: The percentage of Long accounts is 73.1% on Binance, 73.5% on OKX, and 78.1% on Bitget. This means the vast majority of retail traders are trapped on the losing side.
· Funding rates remain positive: They are +0.010% on Binance and OKX, meaning buyers are still paying sellers despite the decline. This means Long leverage has not yet been fully liquidated, and the market has not reached genuine “capitulation.”
· Open interest (OI) is rising: Total OI is $42.6 billion, up 1.5% in 24 hours, with Binance, OKX, and Gate adding positions. This is not deleveraging but the building of new positions in the wrong direction, increasing the risk of a second liquidation wave.
· Recent liquidations: $277 million in 24 hours, 64% of them Longs ($1.77 billion Longs versus $1.0 billion Shorts).
The mechanical takeaway: the market is in a state of “structural selling pressure (ETFs) + liquidation fuel (crowded Longs).” A break below a major support level could open the door to another wave of forced selling.
---
📉 Fifth: Technical structure — where is the “decisive point”?

Bitcoin (BTC): Testing “last support” on the weekly timeframe
· Critical level: **$75,000** is immediate support, but more important is **$73,000 - $74,000**, which represents a **major support zone** (the 50-week moving average and a previous demand zone). A daily break below $73,000 could open the way to **$70,000**, then **$65,000 - $66,000 (a potential accumulation zone).
· Resistance: Reclaiming **$76,000** is the first requirement for any recovery. But **the real resistance** is **$83,000 - $87,000, where more than $11 billion in short-position liquidity is concentrated. A breakout through that zone could trigger a violent “Short Squeeze.”
· Potential positive signal: Around $1 billion in Longs was liquidated recently, meaning much of the forced-selling fuel has been exhausted. If the price holds above $75,000, the divergence from stocks could turn into a “Bear Trap.”
Ethereum (ETH): Structurally weaker
· Support: **$2,100** is immediate support, and a break below it opens the way to **$2,000 (psychological level), then $1,950 - $1,960.
· Resistance: **$2,200** is the first hurdle, followed by **$2,300**. ETH needs to break above $2,320 to change its short-term bearish structure.
Altcoins: “No altseason” — liquidity is pulling out
· The Altcoin Season Index is only at 37-44 (the threshold is 75), and fewer than 35% of altcoins have outperformed BTC over 90 days. This means that buying altcoins in the current liquidity environment is a high-risk gamble.
---
🎯 Sixth: Scenarios and directional conclusion
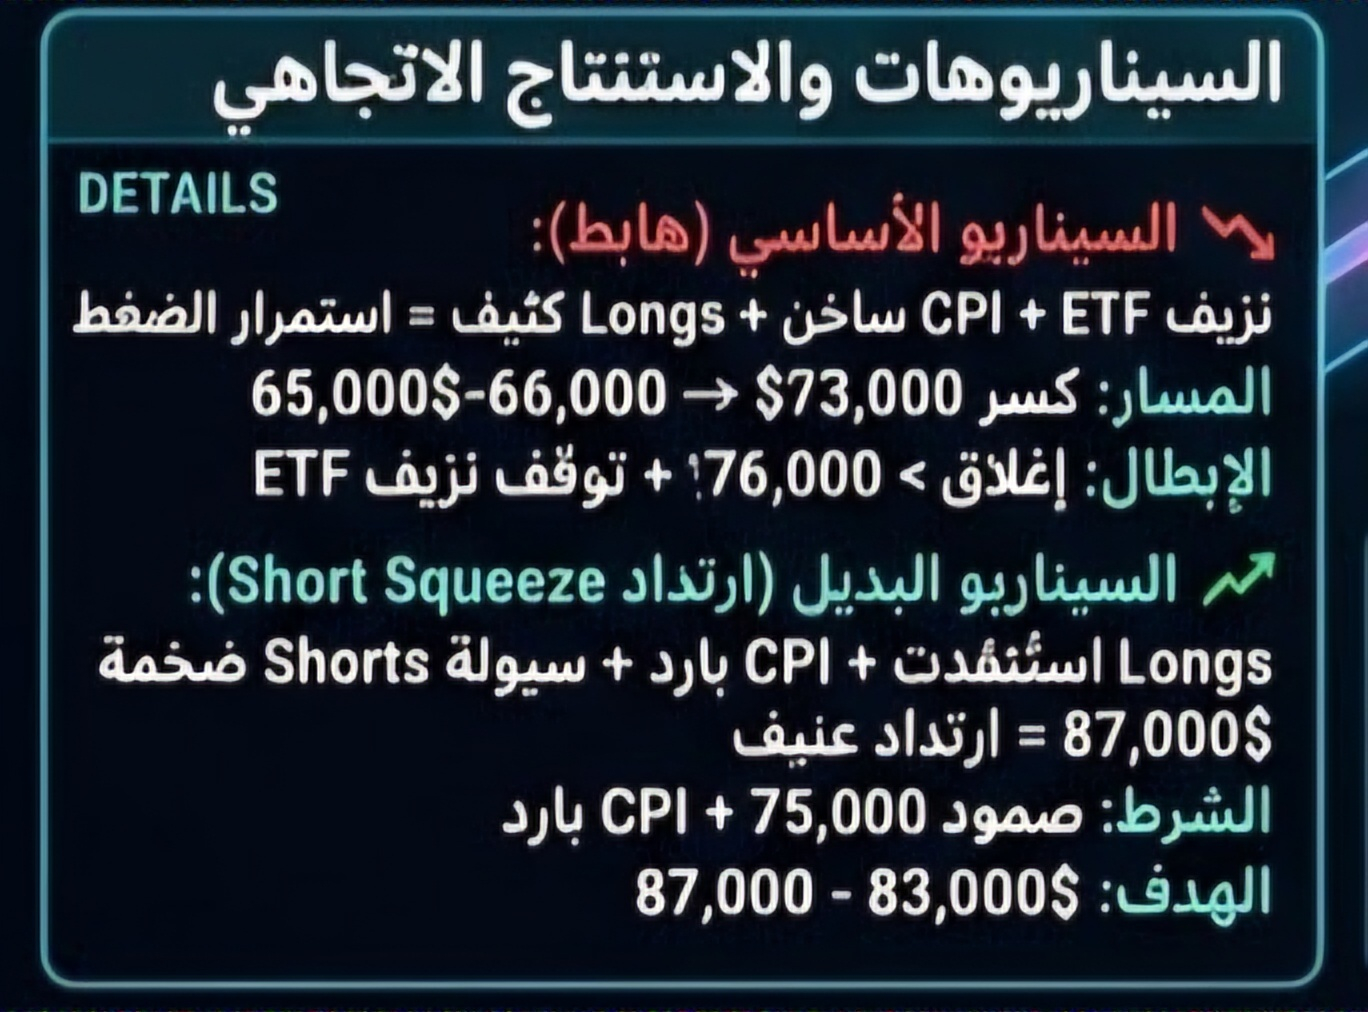
📉 Base-case scenario (bearish — most likely)
Rationale: Continued ETF outflows + hot CPI + heavy Long positioning = continued pressure.
· Path: Break below **$73,000** → **$70,000 → $65,000 - $66,000 (if selling intensifies).
· Invalidation signal: Daily close above $76,000 + a halt in ETF outflows.
📈 Alternative scenario (“Short Squeeze” rebound — possible, but not a reversal)
Rationale: Long liquidations exhausted + cool CPI + massive short liquidity at $87,000 = potential violent rebound.
· Requirement: Hold above $75,000 + CPI data below expectations.
· Target: $83,000 - $87,000 (short accumulation zone). But without a breakout above $87,000, the medium-term trend remains bearish.
⚠️ Risk management in this environment
1. Avoid high leverage: Volatility is high, and any leverage >2x is at risk of liquidation.
2. Position size: ≤1% of capital per trade.
3. Daily monitoring: ETF flows are the most important indicator. An end to the bleeding = the first sign of stability.
4. Don’t “buy the dip” before confirmation: Wait for a daily close above $76,000 or a genuine capitulation signal (such as falling OI with price stabilizing, or Funding turning deeply negative).
---
💎 Executive summary
The market is at a “make-or-break moment”: Bitcoin is testing its last major weekly support, and the immediate driver of the decline is ETF outflows and Long positioning—not strategic selling by holders. The short-term trend is bearish until there is a signal that outflows are stopping or inflation data comes in weaker than expected. The long-term trend (above $65,000) has not officially broken, but is in a critical defensive position. Tonight’s CPI is the first decisive test. Best approach: wait — don’t buy support before confirmation, and don’t sell at the bottom after it’s too late.


