$ETH Evening outlook: 11/10.
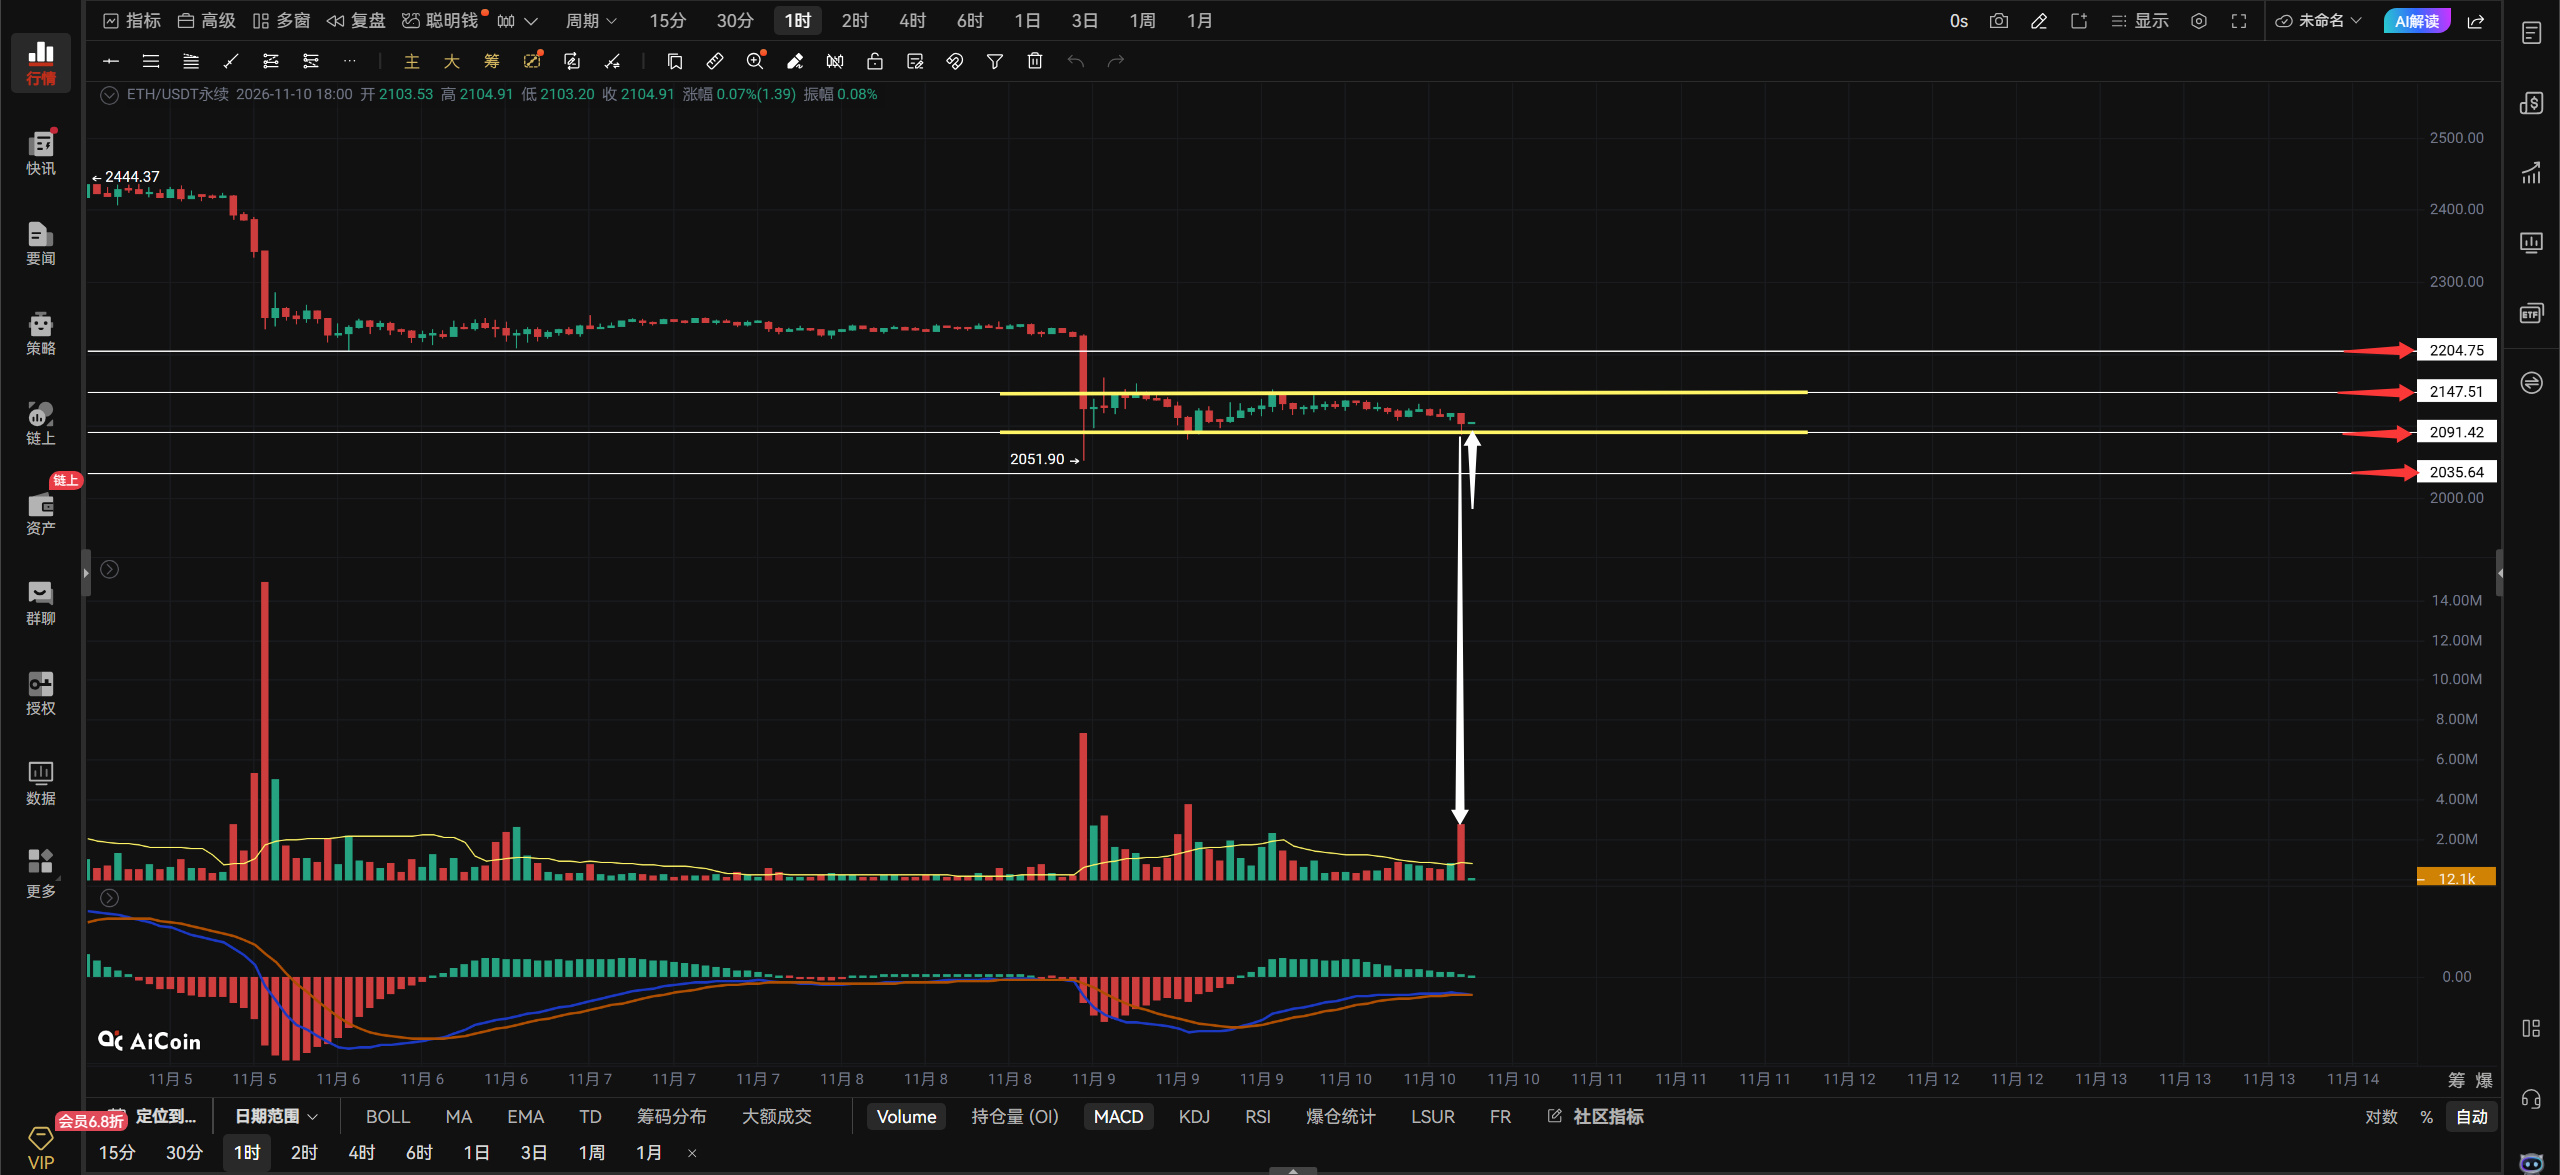
ETH is also moving within a trading range, consolidating between 2147 and 2091. As I keep saying, there won’t be a clear direction until this range breaks. Given the current market action, I’m not even sure how to interpret it 🥲. Look at the volume corresponding to the candlestick marked by the red arrow: volume picked up, but price didn’t follow through, so we’re seeing an unusual volume signal. For now, wait and see how the current candlestick develops. If it closes bullish and engulfs the preceding bearish candle, you can consider going long, with 2147–2204 as the upside target. If the current candle doesn’t close bullish, don’t go long. In that case, price could break below 2091 and test support in the 2051–2035 range. If it does, look for bottoming signals in that range before going long.
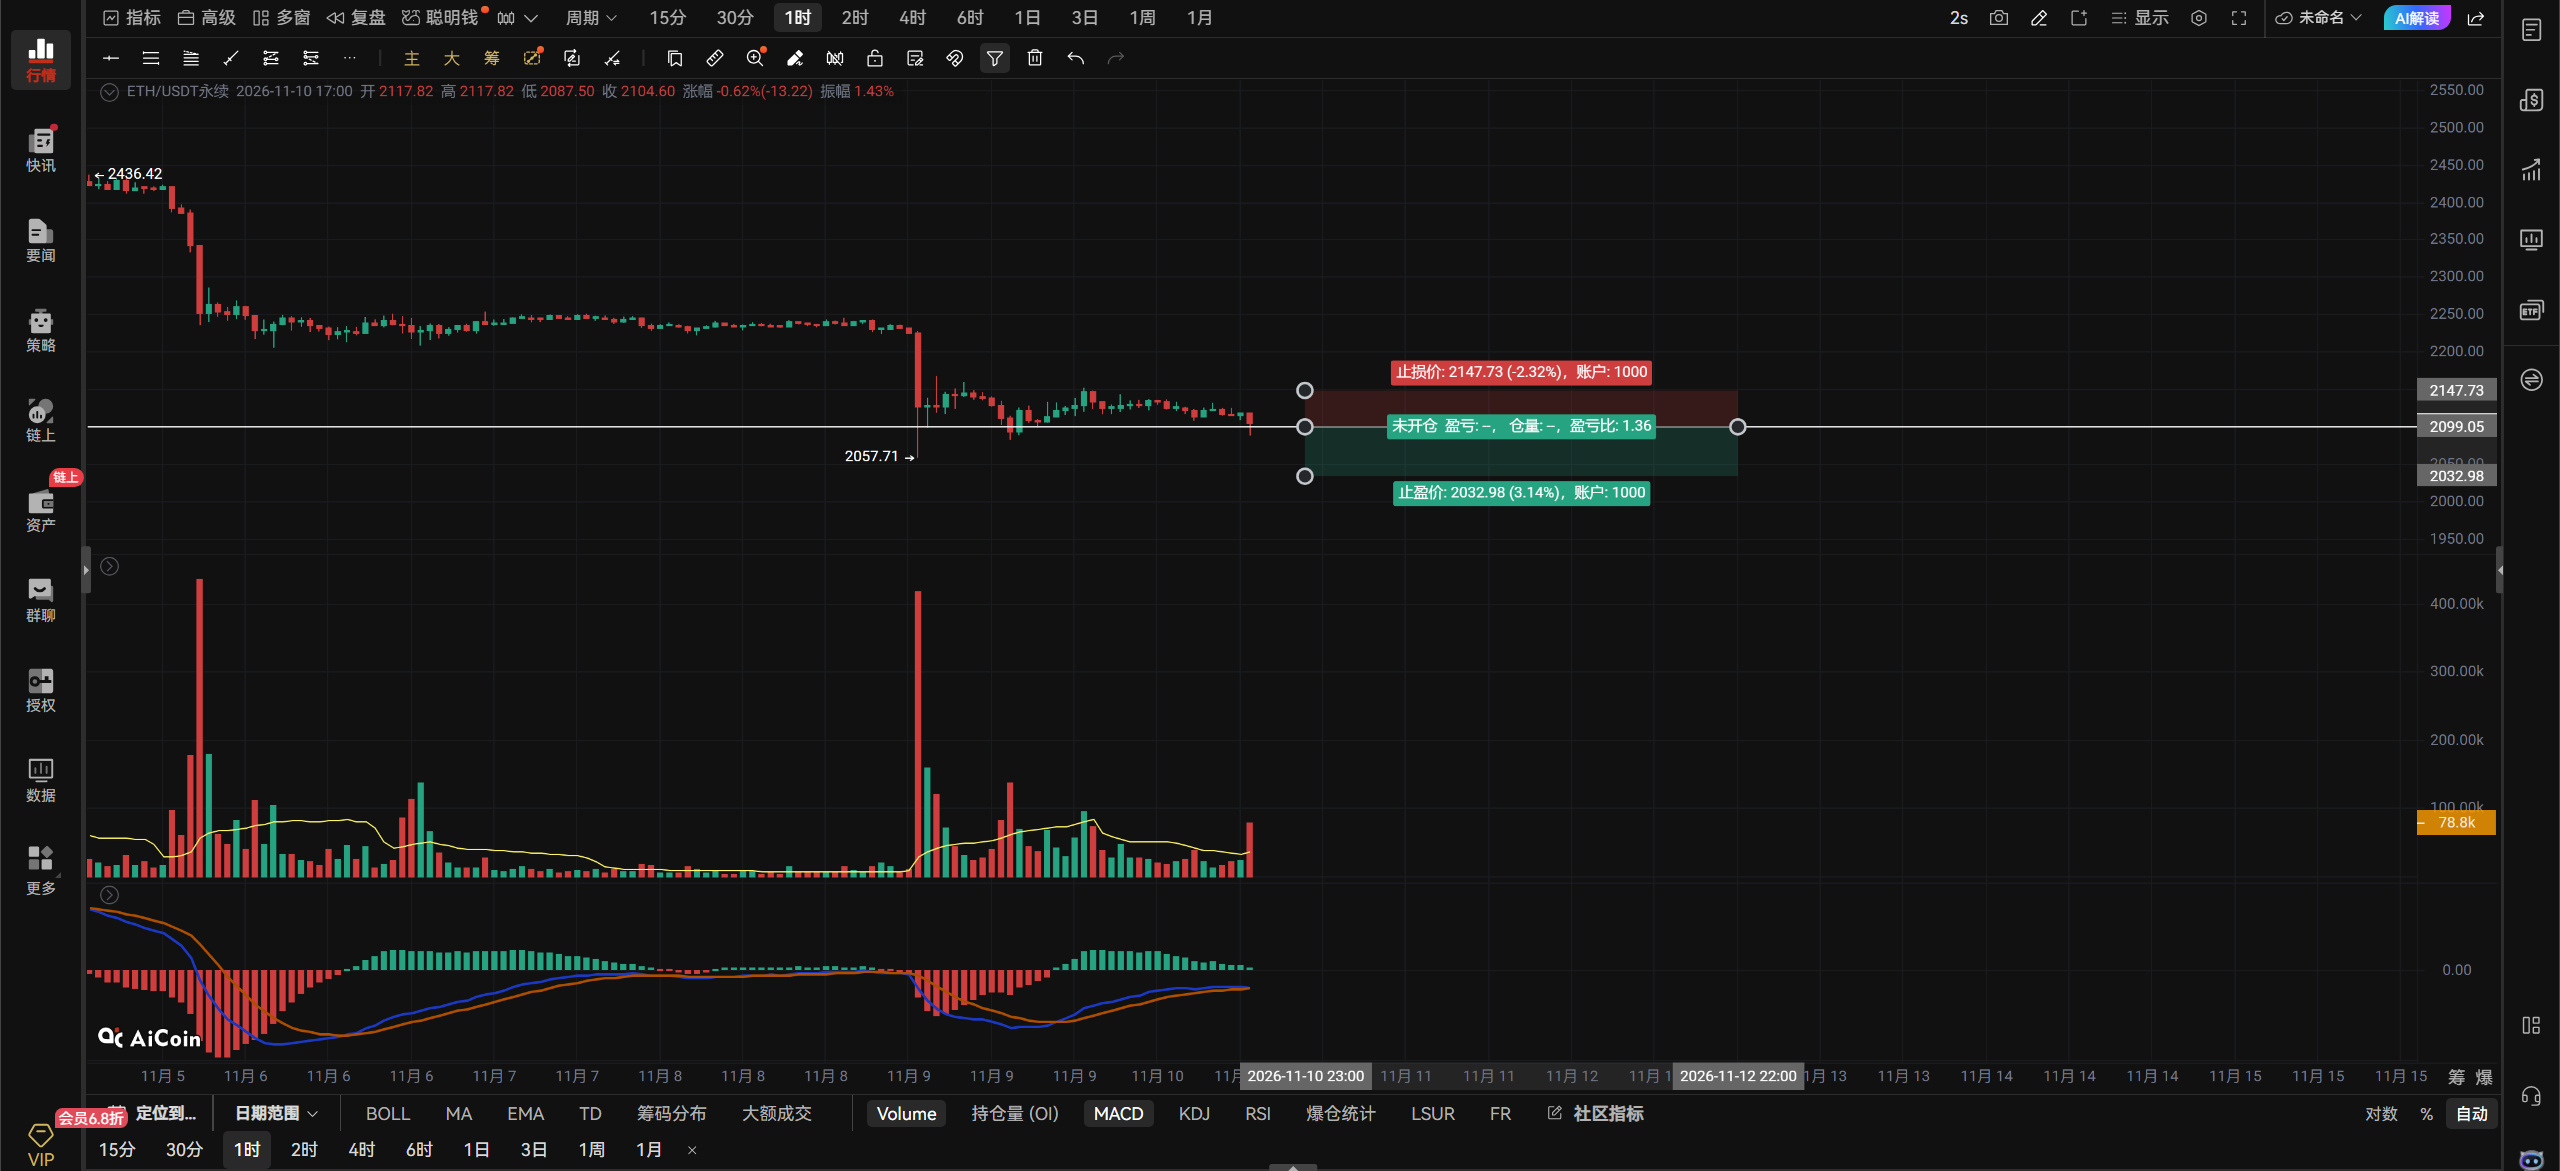
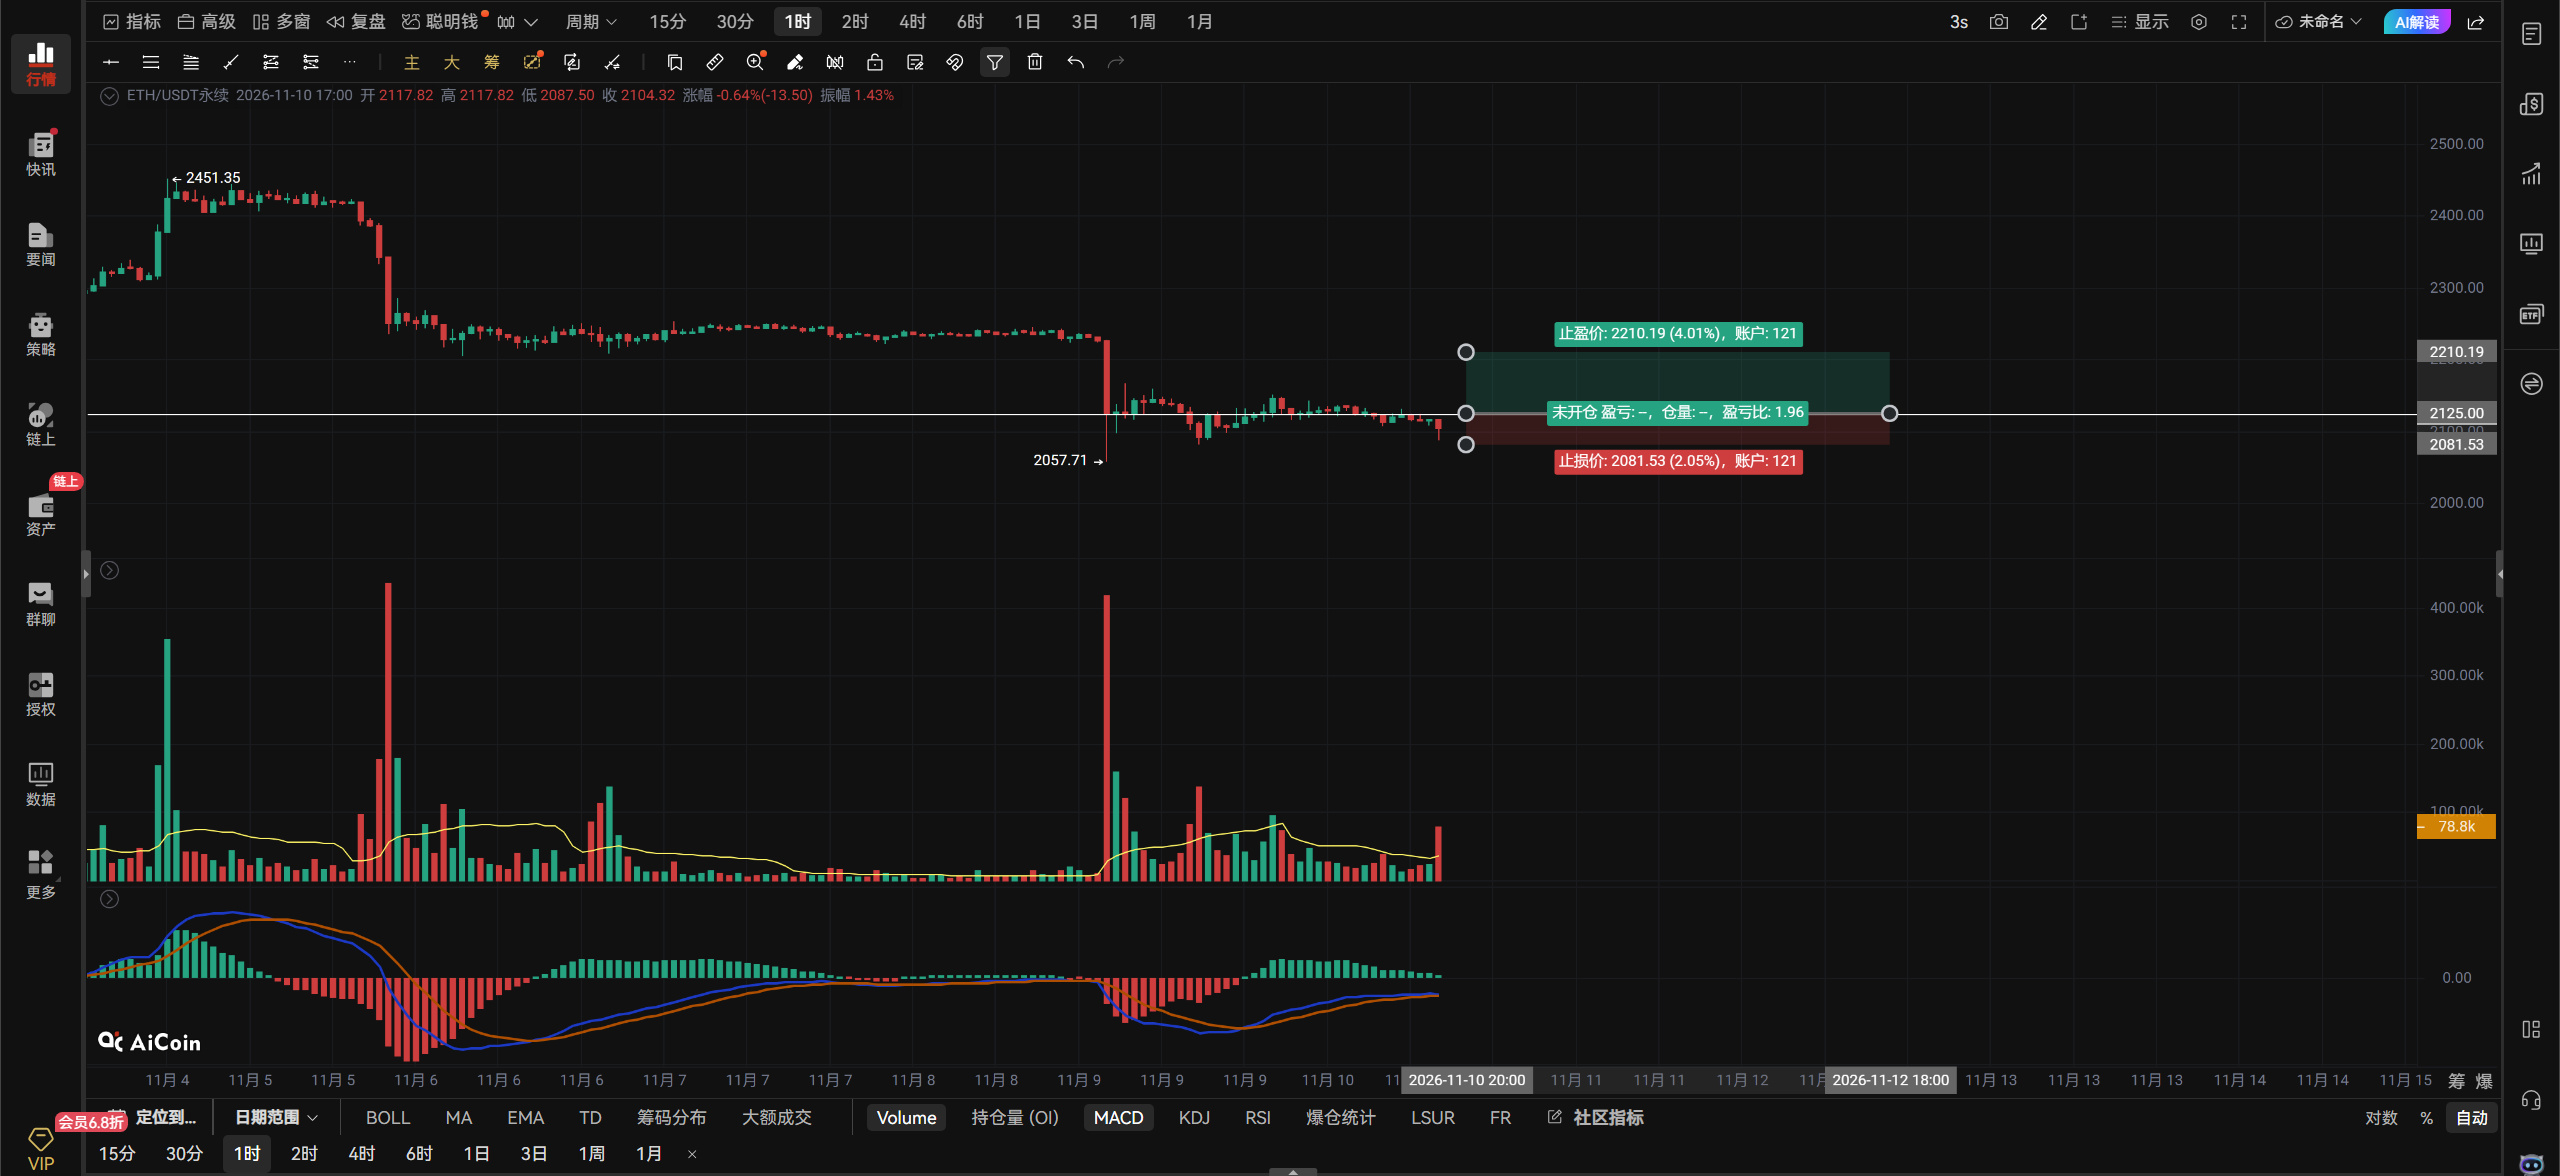
If ETH breaks above 2125 with increased volume, go long on the right side of the move; if it breaks below 2100 with increased volume, go short on the right side. Watch for changes in volume and use stop-losses.
On the hourly chart, if ETH holds above 2125, look for 2147–2204.
On the 4-hour chart, if it breaks below 2100, look for 2051–2035.
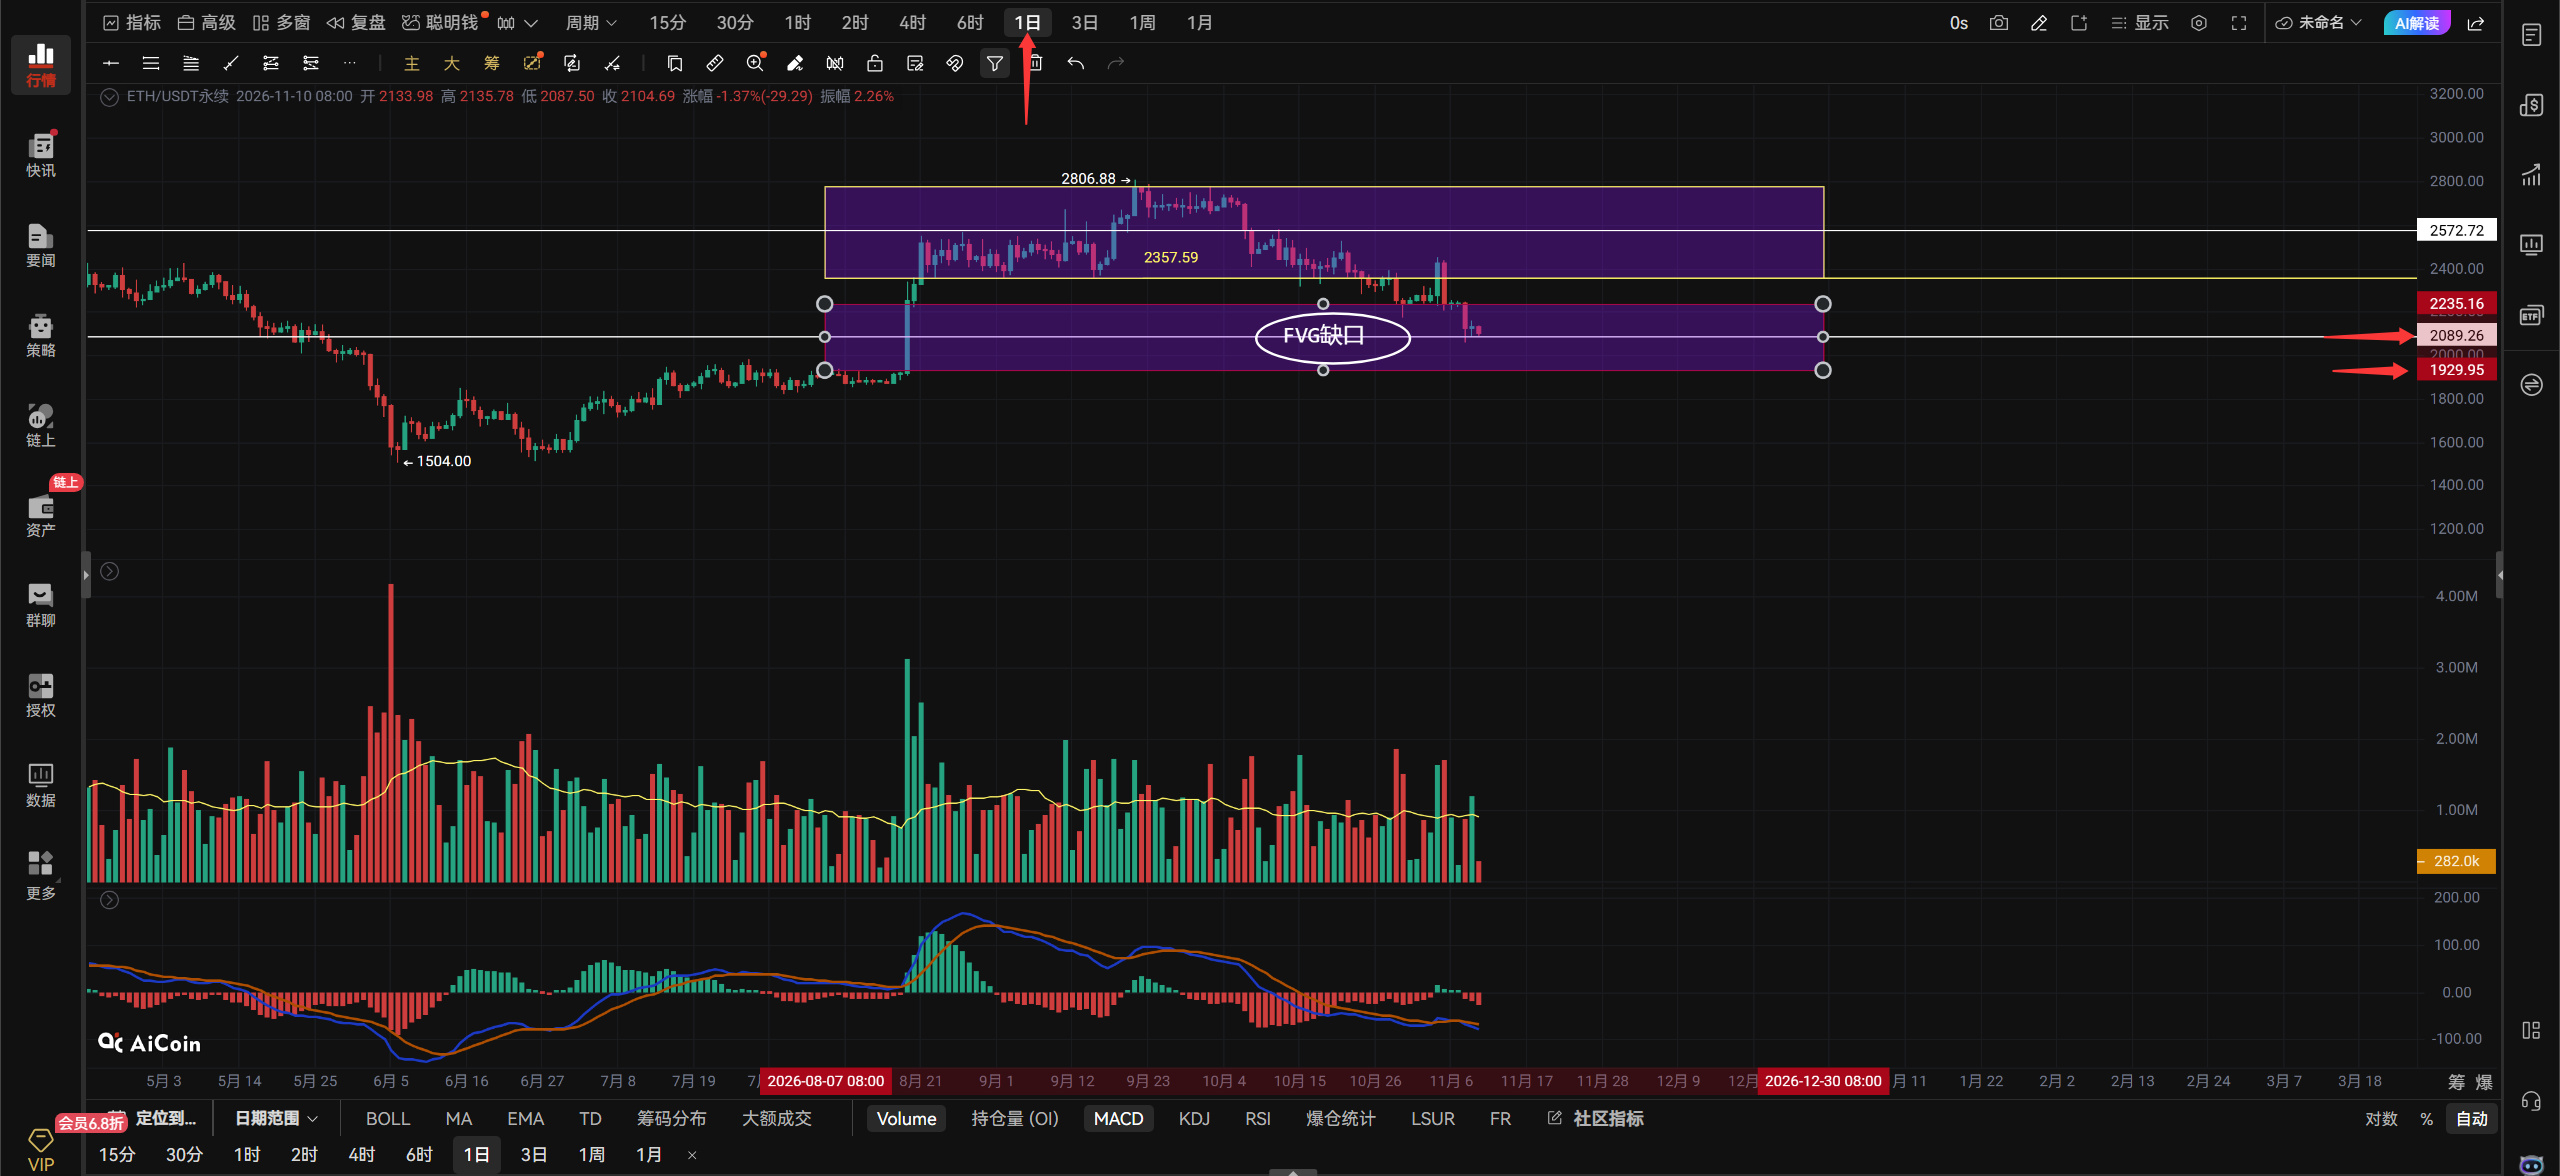
On the daily chart, ETH is filling the daily FVG gap. Watch whether the midpoint of the FVG gap holds. If it does, the decline shouldn’t extend much further, and the FVG gap should be fully filled. If it doesn’t hold, keep an eye on the lower boundary of the daily FVG gap at 1929! That’s all for now.
$ETH
#CPI前瞻,12月利率走向迎关键考验
ETH is also moving within a trading range, consolidating between 2147 and 2091. As I keep saying, there won’t be a clear direction until this range breaks. Given the current market action, I’m not even sure how to interpret it 🥲. Look at the volume corresponding to the candlestick marked by the red arrow: volume picked up, but price didn’t follow through, so we’re seeing an unusual volume signal. For now, wait and see how the current candlestick develops. If it closes bullish and engulfs the preceding bearish candle, you can consider going long, with 2147–2204 as the upside target. If the current candle doesn’t close bullish, don’t go long. In that case, price could break below 2091 and test support in the 2051–2035 range. If it does, look for bottoming signals in that range before going long.
If ETH breaks above 2125 with increased volume, go long on the right side of the move; if it breaks below 2100 with increased volume, go short on the right side. Watch for changes in volume and use stop-losses.
On the hourly chart, if ETH holds above 2125, look for 2147–2204.
On the 4-hour chart, if it breaks below 2100, look for 2051–2035.
On the daily chart, ETH is filling the daily FVG gap. Watch whether the midpoint of the FVG gap holds. If it does, the decline shouldn’t extend much further, and the FVG gap should be fully filled. If it doesn’t hold, keep an eye on the lower boundary of the daily FVG gap at 1929! That’s all for now.
$ETH
#CPI前瞻,12月利率走向迎关键考验