
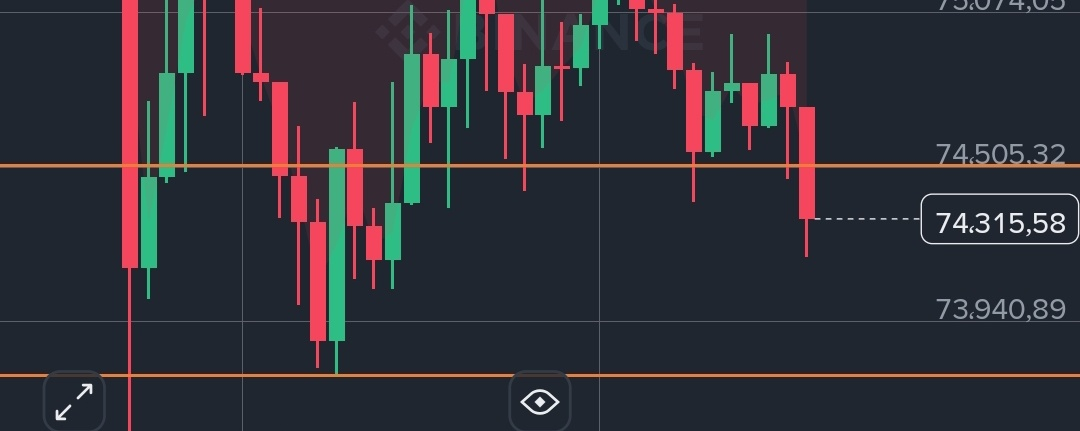


Bitcoin is currently trading at 74315
@
We are entering a genuine phase of conflict, and it is within this particular range that the shape of the structure to come will become clear. So let’s not jump to conclusions; instead, let’s watch how the structure is built, how bullish and bearish pressure takes shape within it, and how that is reflected in price action and candle closes.
Preparation and conflict range:
74,500 – 73,674
Bullish scenario:
Holding above 74,500 with clear upward momentum could give the price the ability to regain its footing and move toward a breakout above 79,200 and then 81,462.
This brings us to the key decision point: holding above 81,462 would be an early indication that 57,000 may be the current cycle bottom, and that the bottom-building phase may be over, allowing us to begin watching for a new bullish structure to form.
Bearish scenario:
A break below 73,674 without the ability to reclaim the battleground area would bring selling pressure back to the forefront.
A close below 70,450, meanwhile, would be an early signal of a change in the market’s direction, open the door to a scenario of new lows, and put the assumption that 57,000 is the current cycle bottom to a real test.
What matters to us now is not predicting the top or bottom, but watching the process of structure-building and gauging the balance of pressure between buyers and sellers. The sequence of highs, lows, and closes will show us who is in control and which way the balance is tipping.
Let’s see how the market builds its next structure. The numbers define the decision points, while price action gives us the answer.
An analytical technical reading based on my own model and experience in reading market movements; this is not financial advice.
And God knows best.
Best of luck to everyone.