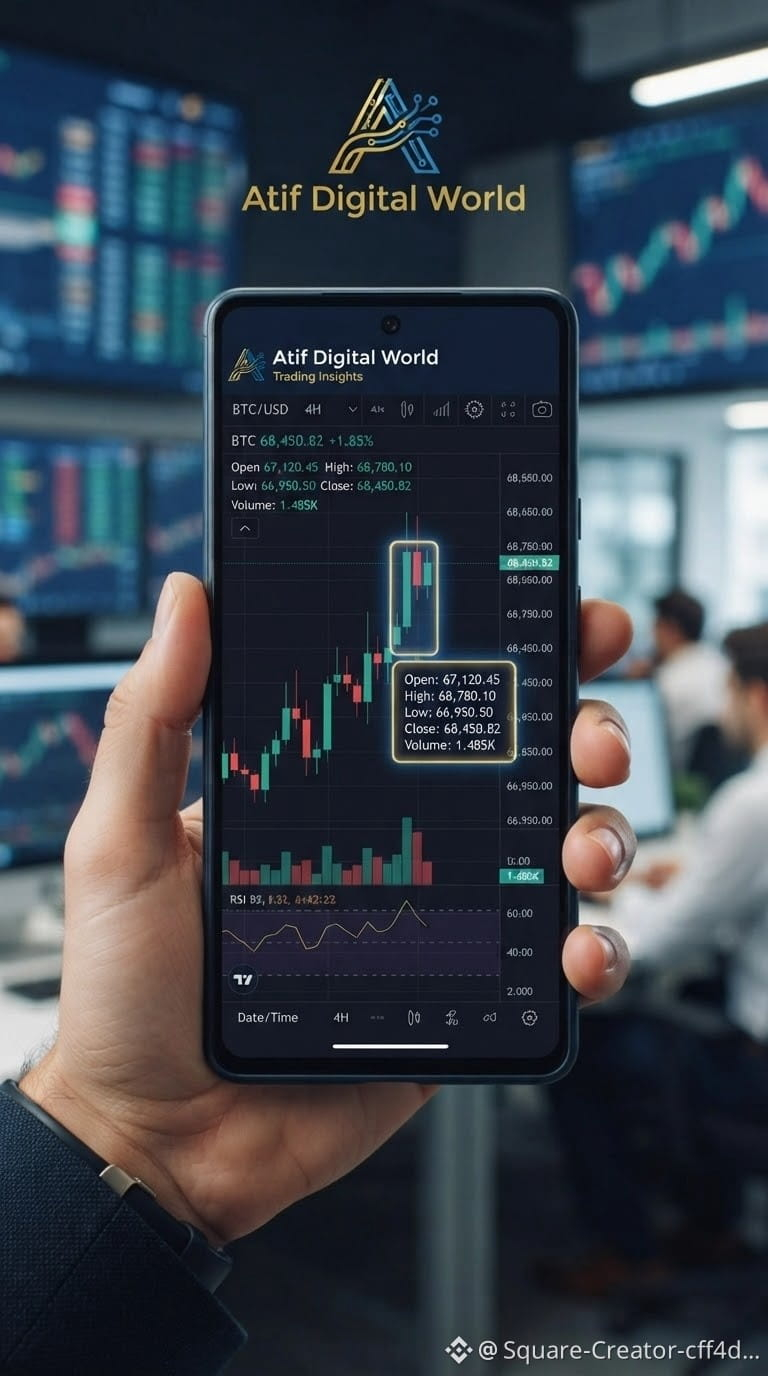
📊 Backtesting – Lesson Two: How Do You Get Historical Price Data?
In the first lesson, we learned about the concept of Backtesting. Today, we’re moving on to an important step: getting historical market data! 🚀
Before testing any trading strategy, we need to know how prices moved in the past.
🔍 What data do we need?
1️⃣ Open – Opening price.
2️⃣ High – Highest price.
3️⃣ Low – Lowest price.
4️⃣ Close – Closing price.
5️⃣ Volume – Trading volume.
📱 Practical exercise:
Open TradingView on your phone:
- Search for BTCUSDT.
- Open the candlestick chart.
- Select the 1D timeframe.
- Tap an old candle to view its data.
- Compare the opening and closing prices.
💡 Example:
If Bitcoin opened at $90,000 and closed at $92,000, that means the candle is bullish.
⚠️ Remember: Historical data helps us test strategies, but it does not guarantee future profits.
🎯 Test your knowledge:
If the opening price is $90,000 and the closing price is $92,000, what does that mean?
A️⃣ The price went up.
B️⃣ The price went down.
C️⃣ The price did not change.
Write your answer in the comments! 👇
📚 Follow the Backtesting series with Atif Digital World, and learn to trade scientifically, step by step.
#Backtesting #TradingView #Bitcoin #CryptoEducation #BinanceSquare
This content is for educational purposes only and is not investment advice or a recommendation to buy or sell.
$BTC
$PEPE
$PENDLE
In the first lesson, we learned about the concept of Backtesting. Today, we’re moving on to an important step: getting historical market data! 🚀
Before testing any trading strategy, we need to know how prices moved in the past.
🔍 What data do we need?
1️⃣ Open – Opening price.
2️⃣ High – Highest price.
3️⃣ Low – Lowest price.
4️⃣ Close – Closing price.
5️⃣ Volume – Trading volume.
📱 Practical exercise:
Open TradingView on your phone:
- Search for BTCUSDT.
- Open the candlestick chart.
- Select the 1D timeframe.
- Tap an old candle to view its data.
- Compare the opening and closing prices.
💡 Example:
If Bitcoin opened at $90,000 and closed at $92,000, that means the candle is bullish.
⚠️ Remember: Historical data helps us test strategies, but it does not guarantee future profits.
🎯 Test your knowledge:
If the opening price is $90,000 and the closing price is $92,000, what does that mean?
A️⃣ The price went up.
B️⃣ The price went down.
C️⃣ The price did not change.
Write your answer in the comments! 👇
📚 Follow the Backtesting series with Atif Digital World, and learn to trade scientifically, step by step.
#Backtesting #TradingView #Bitcoin #CryptoEducation #BinanceSquare
This content is for educational purposes only and is not investment advice or a recommendation to buy or sell.
$BTC
$PEPE
$PENDLE