$HYPE
ALERT: A BEARISH TRAP HIDING BEHIND A GREEN CANDLE? ⚠️
Do not let the +1.31% 24-hour change fool you. Hyperliquid ($HYPE) is currently printing a Bearish market structure, and the underlying data shows a market that is completely stuck in the mud.
Here is the exact breakdown of what is happening right now:
📊 The Market Overview:
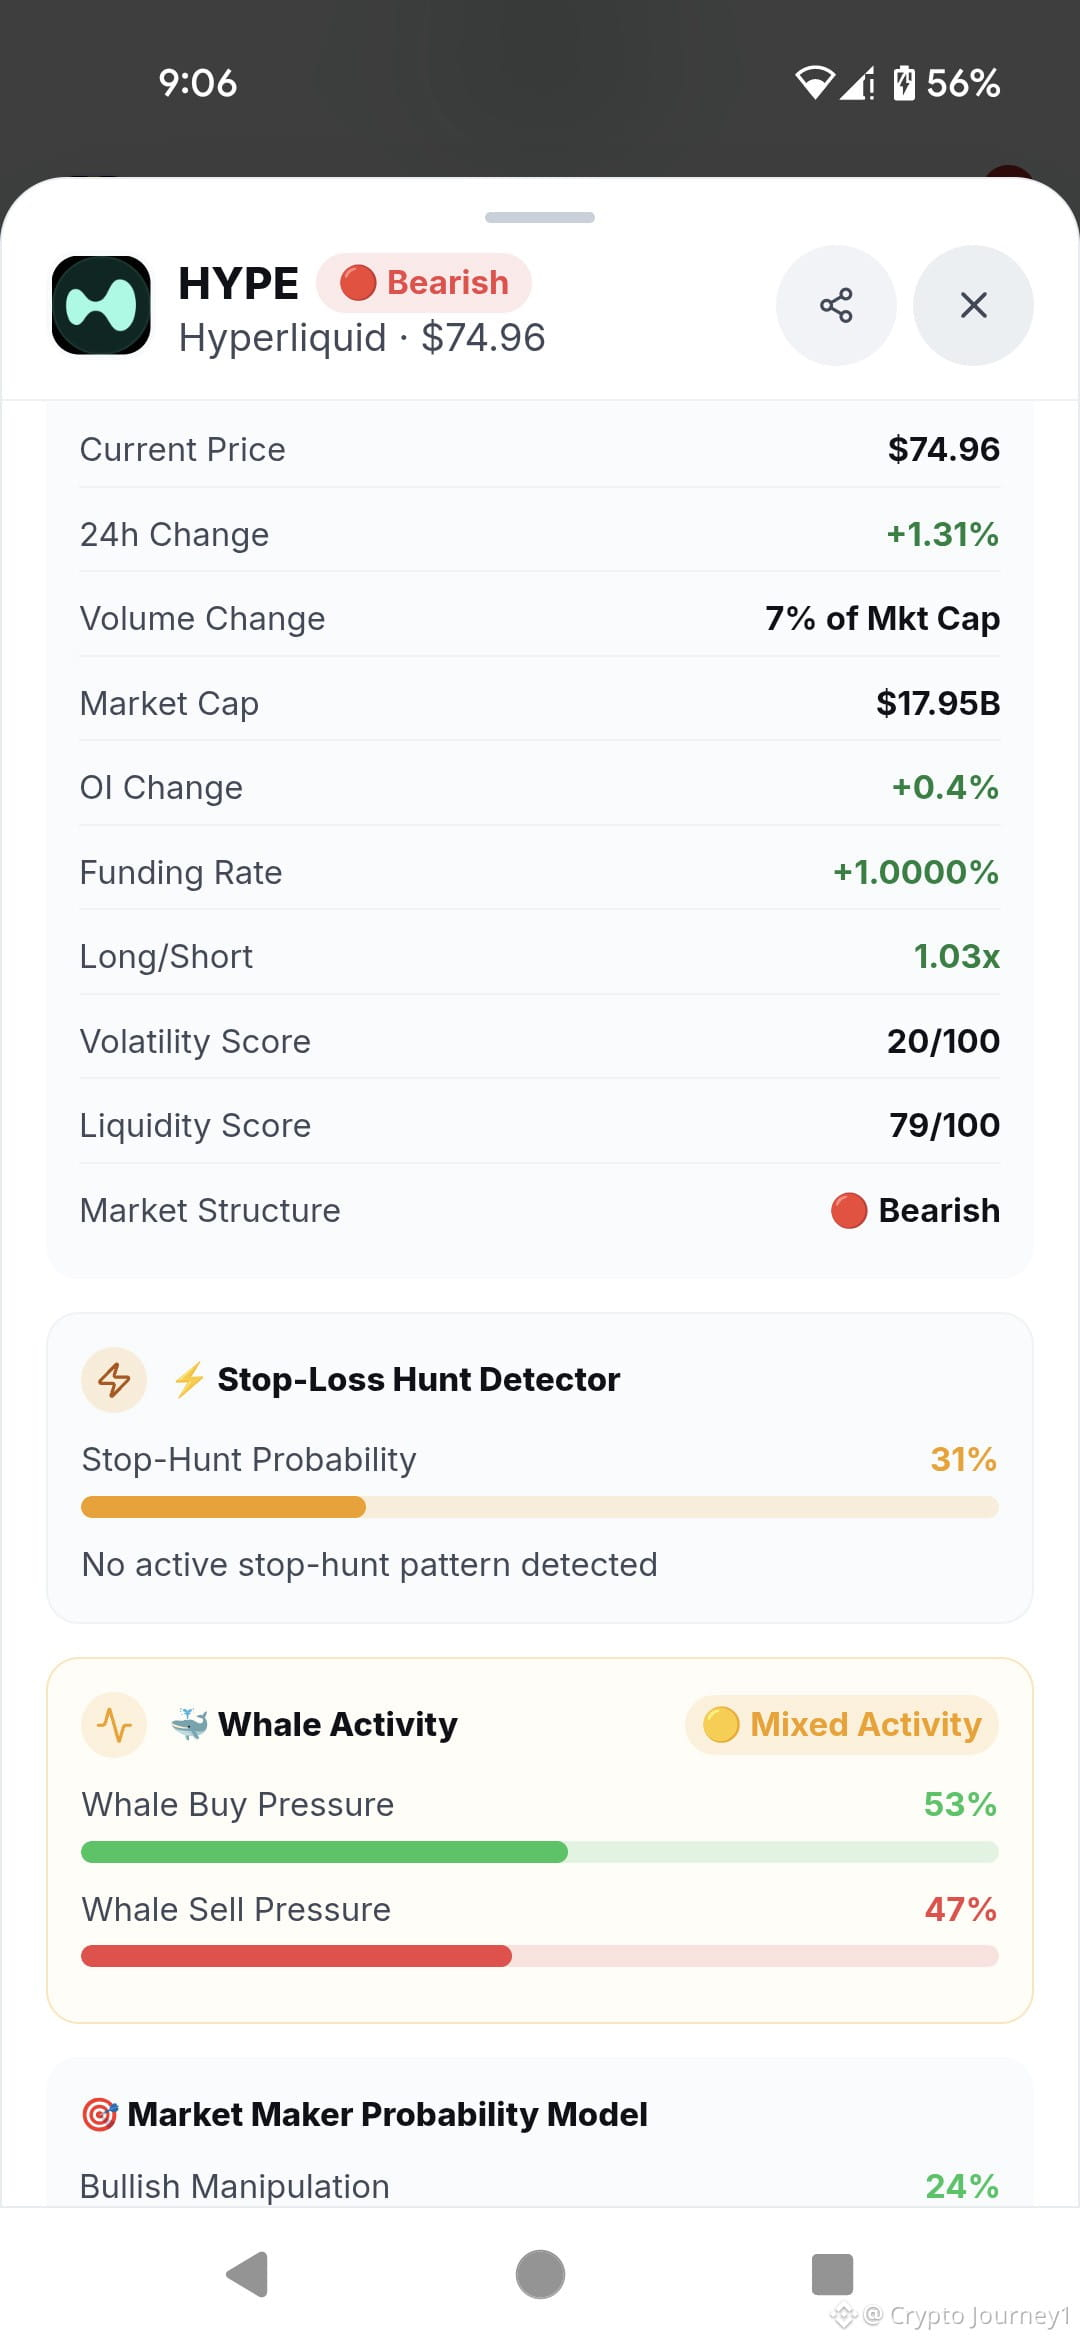
· Current Price: $74.96
· **Market Cap:** $17.95B
· Volume Change: 7% of Mkt Cap
· Open Interest (OI) Change: +0.4%
· Funding Rate: +1.0000% (Long/Short ratio is 1.03x).
· Volatility Score: A dead 20/100.
· Liquidity Score: 79/100.
🐋 Whale & Maker Activity:
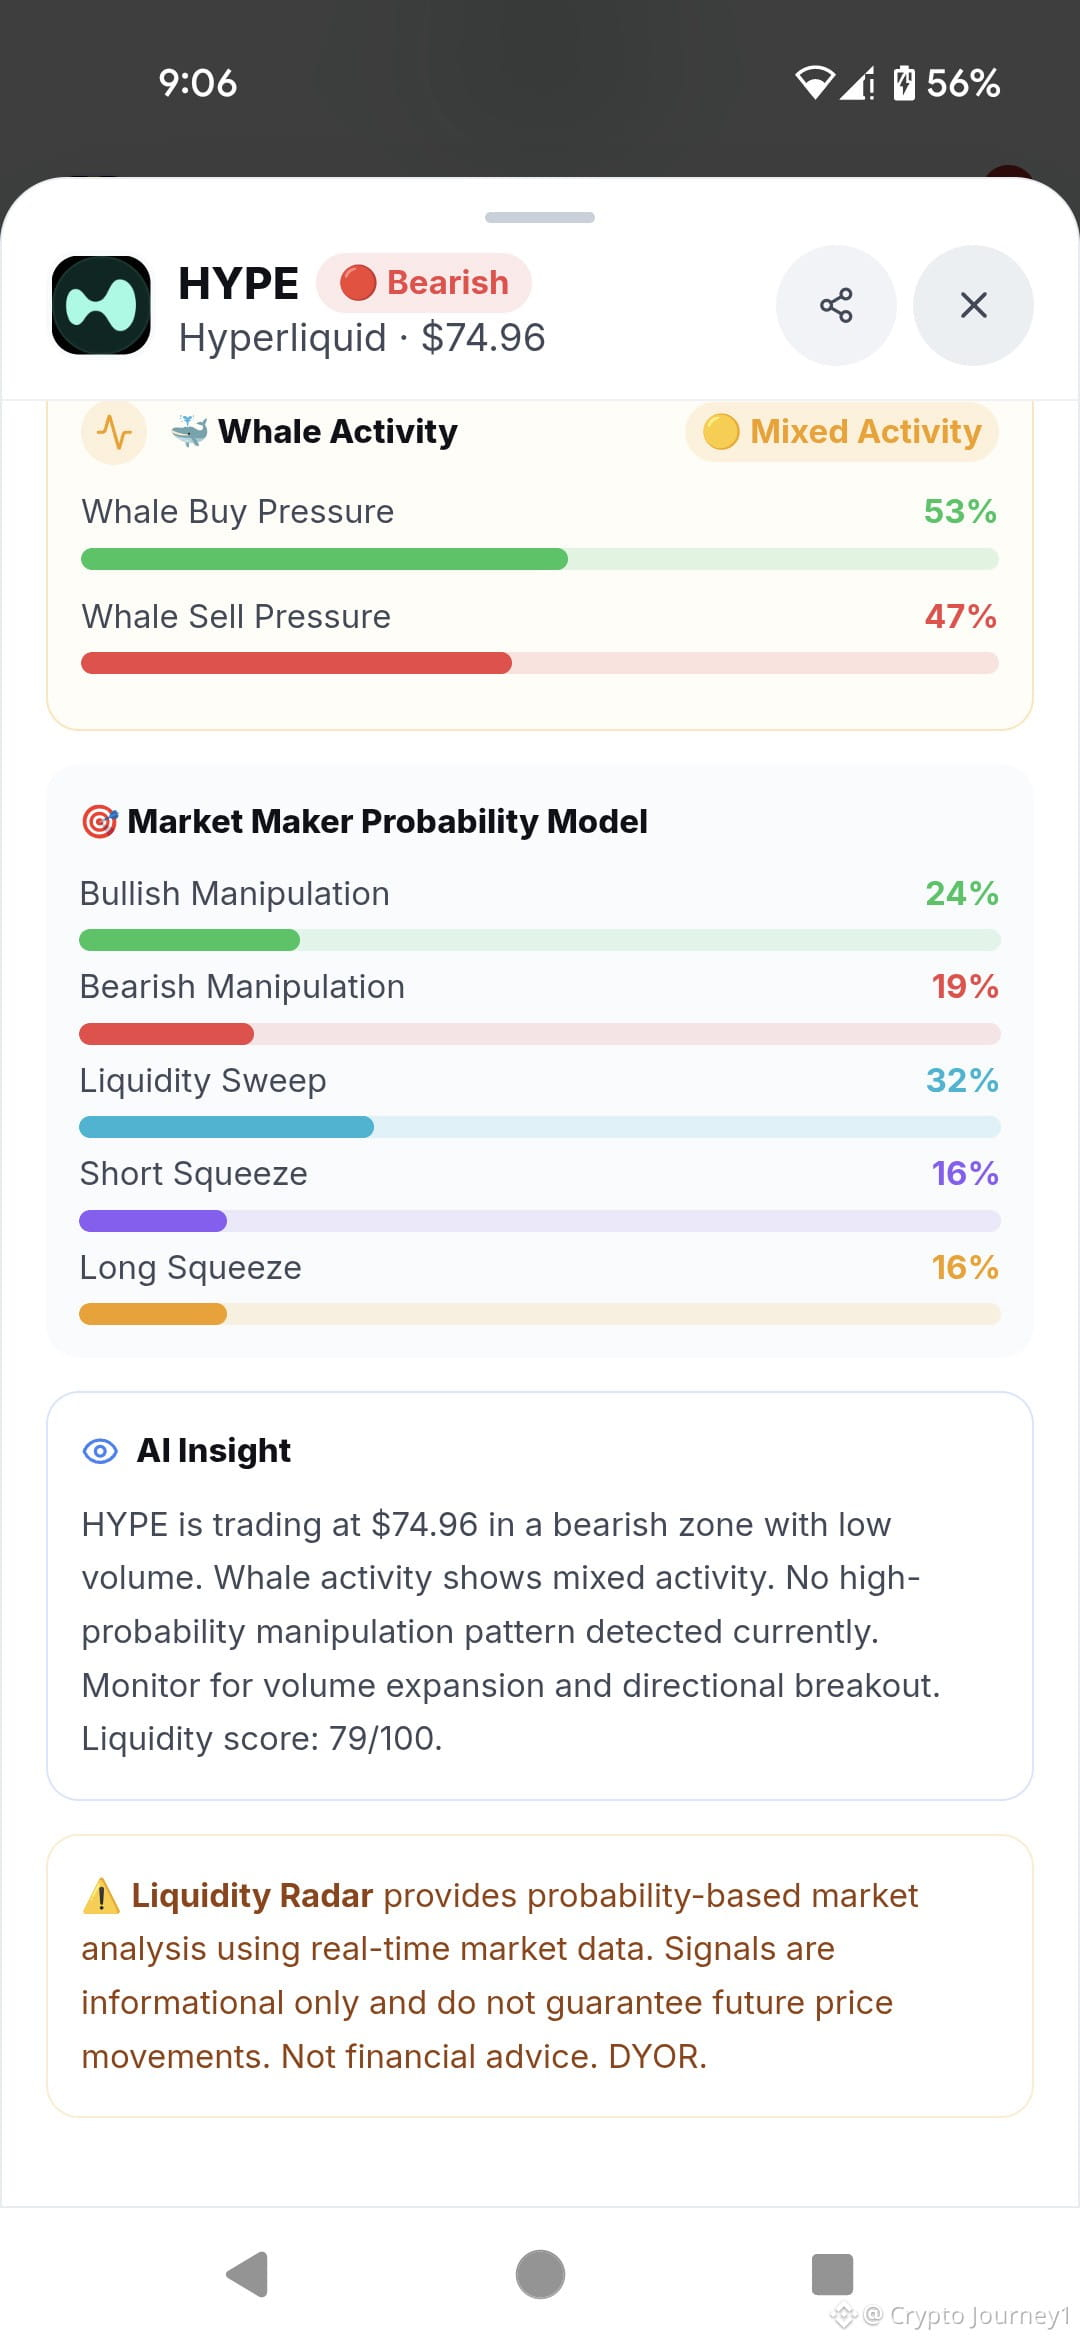
· Whale Activity: Mixed. Buy Pressure is slightly ahead at 53%, with Sell Pressure at 47%.
· Market Maker Model: Liquidity Sweep (32%), Bullish Manipulation (24%), Bearish Manipulation (19%), Short Squeeze (16%), Long Squeeze (16%).
· Trap Detector: Stop-Hunt Probability is sitting at 31% with no active patterns detected.
🎯 My Trade Setup (SHORT Position):
Because the overarching structure is bearish, I am looking to short any fake breakouts or pumps into resistance.
· Entry Zone: $75.50 - $76.50 (Wait for a push up).
· Take Profit 1 (TP1): $72.00
· **Take Profit 2 (TP2):** $69.50
· Stop Loss (SL): $78.00 (Above the recent local highs).
· Risk/Reward: Roughly 1:2.
💡 The Reality Check:
The system readout explains it clearly: "HYPE is trading in a bearish zone with low volume. Whale activity shows mixed activity. No high-probability manipulation pattern detected currently. Monitor for volume expansion and directional breakout."
With volatility this low and the structure pointing down, buying the green candle is risky. Play the trend and protect your capital.
Are you shorting this HYPE setup, or waiting for a volume breakout? 👇
ALERT: A BEARISH TRAP HIDING BEHIND A GREEN CANDLE? ⚠️
Do not let the +1.31% 24-hour change fool you. Hyperliquid ($HYPE) is currently printing a Bearish market structure, and the underlying data shows a market that is completely stuck in the mud.
Here is the exact breakdown of what is happening right now:
📊 The Market Overview:
· Current Price: $74.96
· **Market Cap:** $17.95B
· Volume Change: 7% of Mkt Cap
· Open Interest (OI) Change: +0.4%
· Funding Rate: +1.0000% (Long/Short ratio is 1.03x).
· Volatility Score: A dead 20/100.
· Liquidity Score: 79/100.
🐋 Whale & Maker Activity:
· Whale Activity: Mixed. Buy Pressure is slightly ahead at 53%, with Sell Pressure at 47%.
· Market Maker Model: Liquidity Sweep (32%), Bullish Manipulation (24%), Bearish Manipulation (19%), Short Squeeze (16%), Long Squeeze (16%).
· Trap Detector: Stop-Hunt Probability is sitting at 31% with no active patterns detected.
🎯 My Trade Setup (SHORT Position):
Because the overarching structure is bearish, I am looking to short any fake breakouts or pumps into resistance.
· Entry Zone: $75.50 - $76.50 (Wait for a push up).
· Take Profit 1 (TP1): $72.00
· **Take Profit 2 (TP2):** $69.50
· Stop Loss (SL): $78.00 (Above the recent local highs).
· Risk/Reward: Roughly 1:2.
💡 The Reality Check:
The system readout explains it clearly: "HYPE is trading in a bearish zone with low volume. Whale activity shows mixed activity. No high-probability manipulation pattern detected currently. Monitor for volume expansion and directional breakout."
With volatility this low and the structure pointing down, buying the green candle is risky. Play the trend and protect your capital.
Are you shorting this HYPE setup, or waiting for a volume breakout? 👇