



American trader JJ Simon was just in his early twenties when he made over $1.8 million—more than 12 million yuan—in just over a year.
According to him, all that money came from his profit splits with proprietary trading firms. He started with just $5,000, which he won playing poker while he was in college.
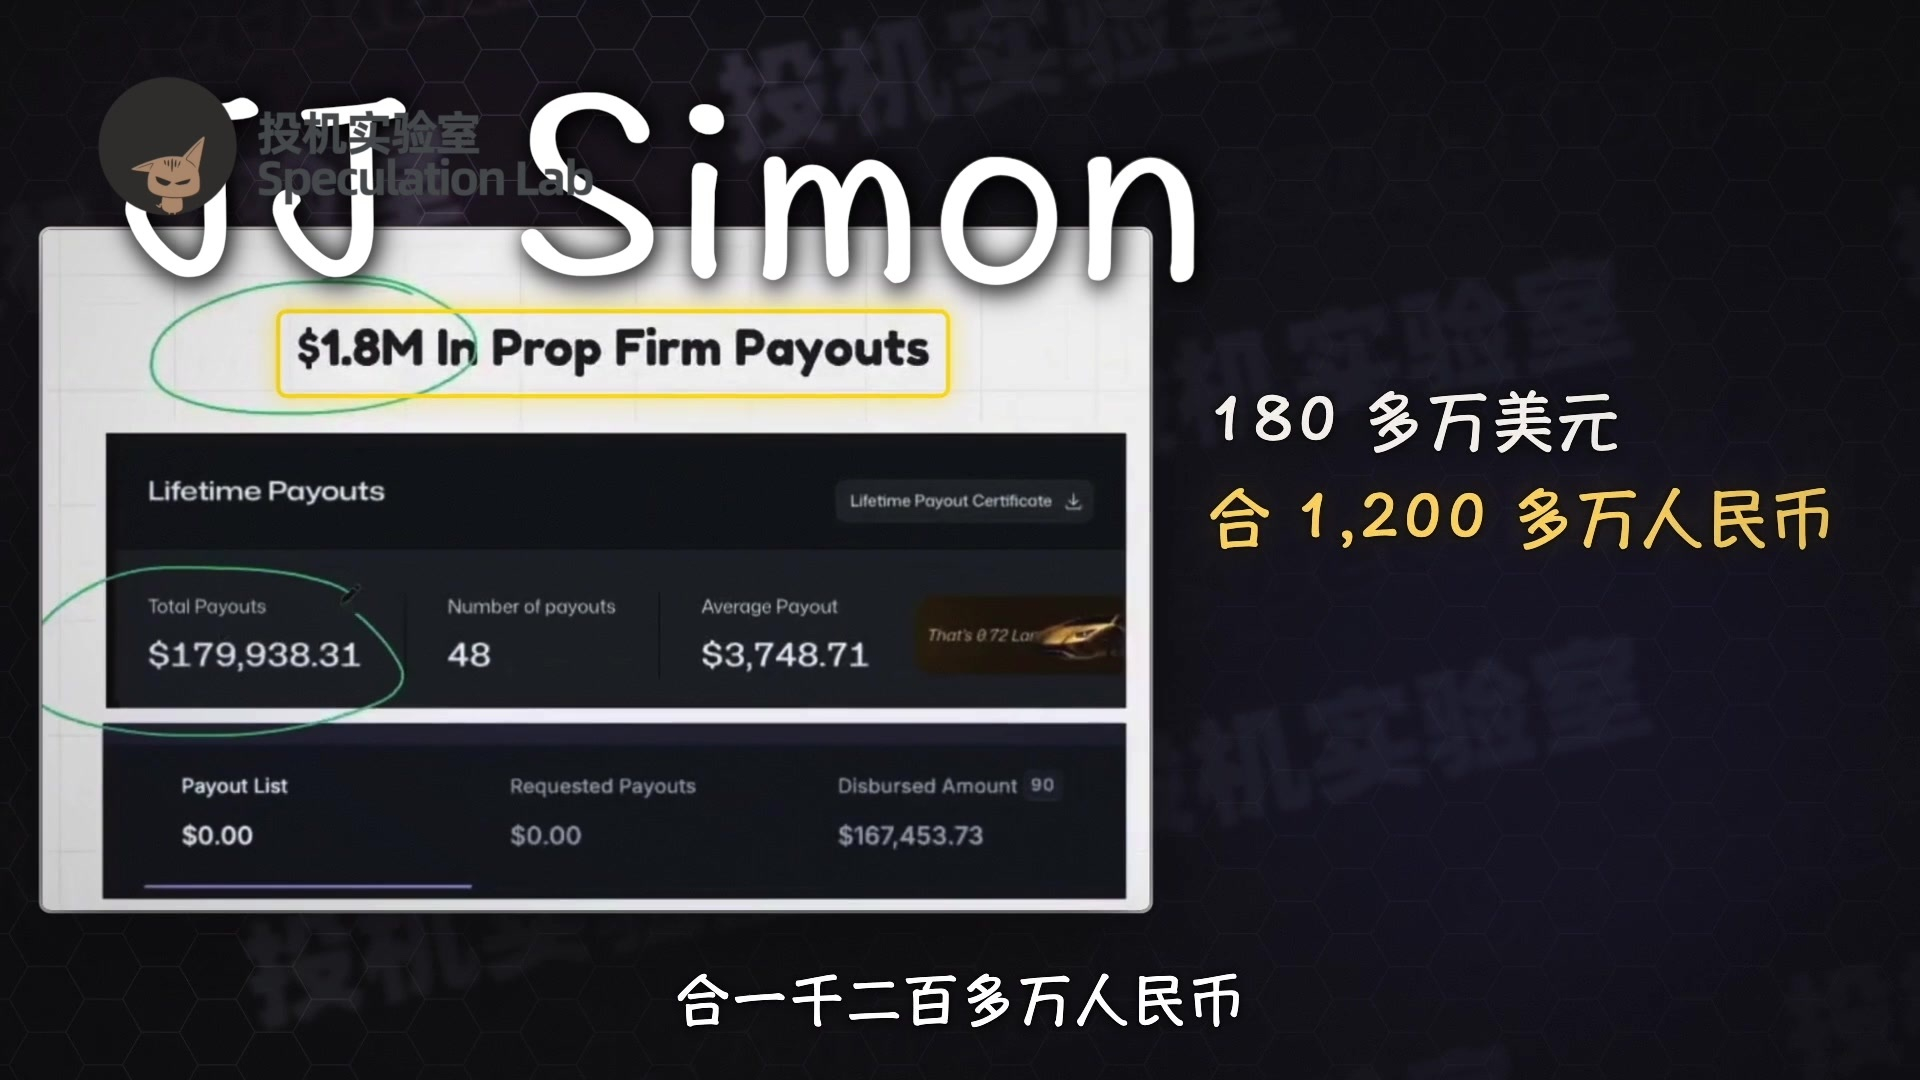
He’s made a lot of money, but he’s also spent a lot. He spent over $500,000 just on evaluations to get trading accounts, so the risks are still pretty high.
He graduated from the University of Washington in 2025 with a degree in computational finance, and he graduated with honors. He says he trades using the same methods he learned at university, so he’s formally trained in the field. Put simply, he applies them mechanically to candlestick charts.

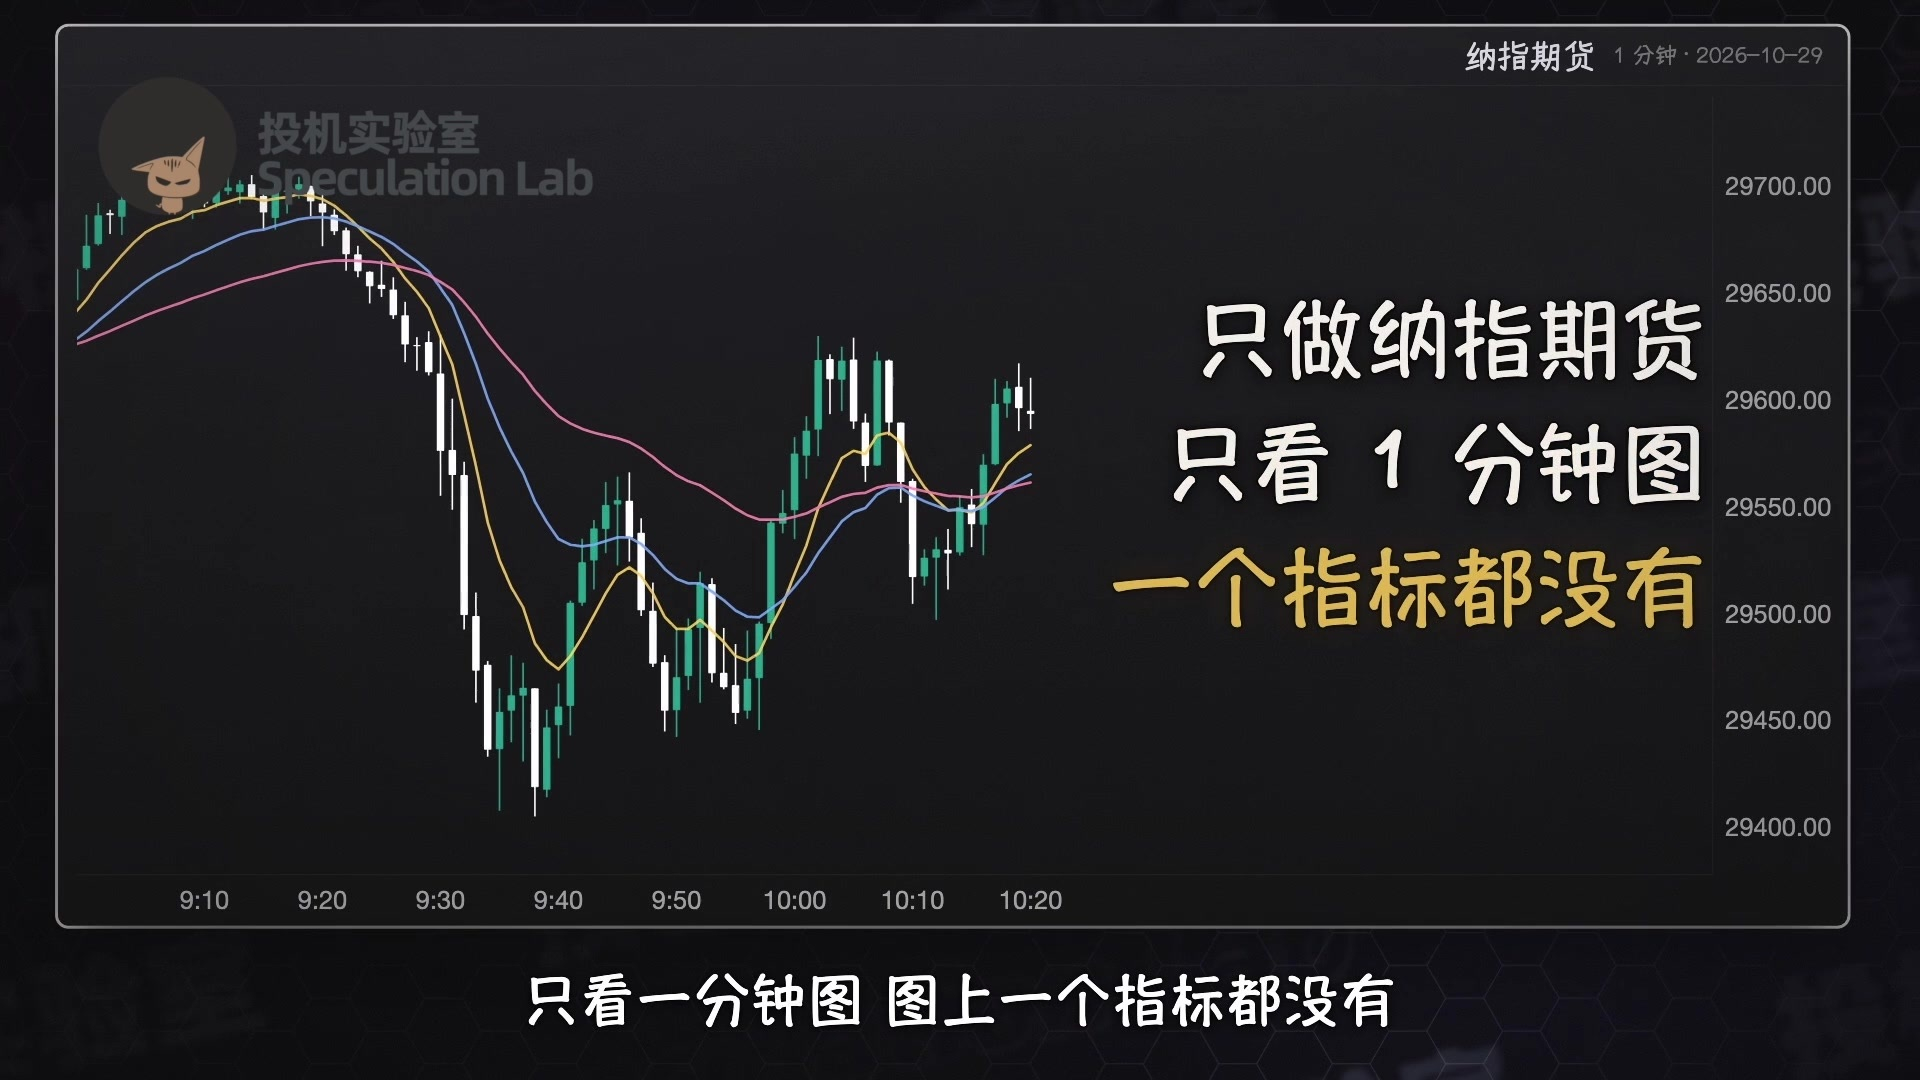
He trades only Nasdaq futures and looks only at one-minute charts. There are no indicators on his charts. The one-minute chart moves so quickly that he doesn’t need them. When to enter, when to exit for a profit, and when to exit at a loss are all fixed in advance.
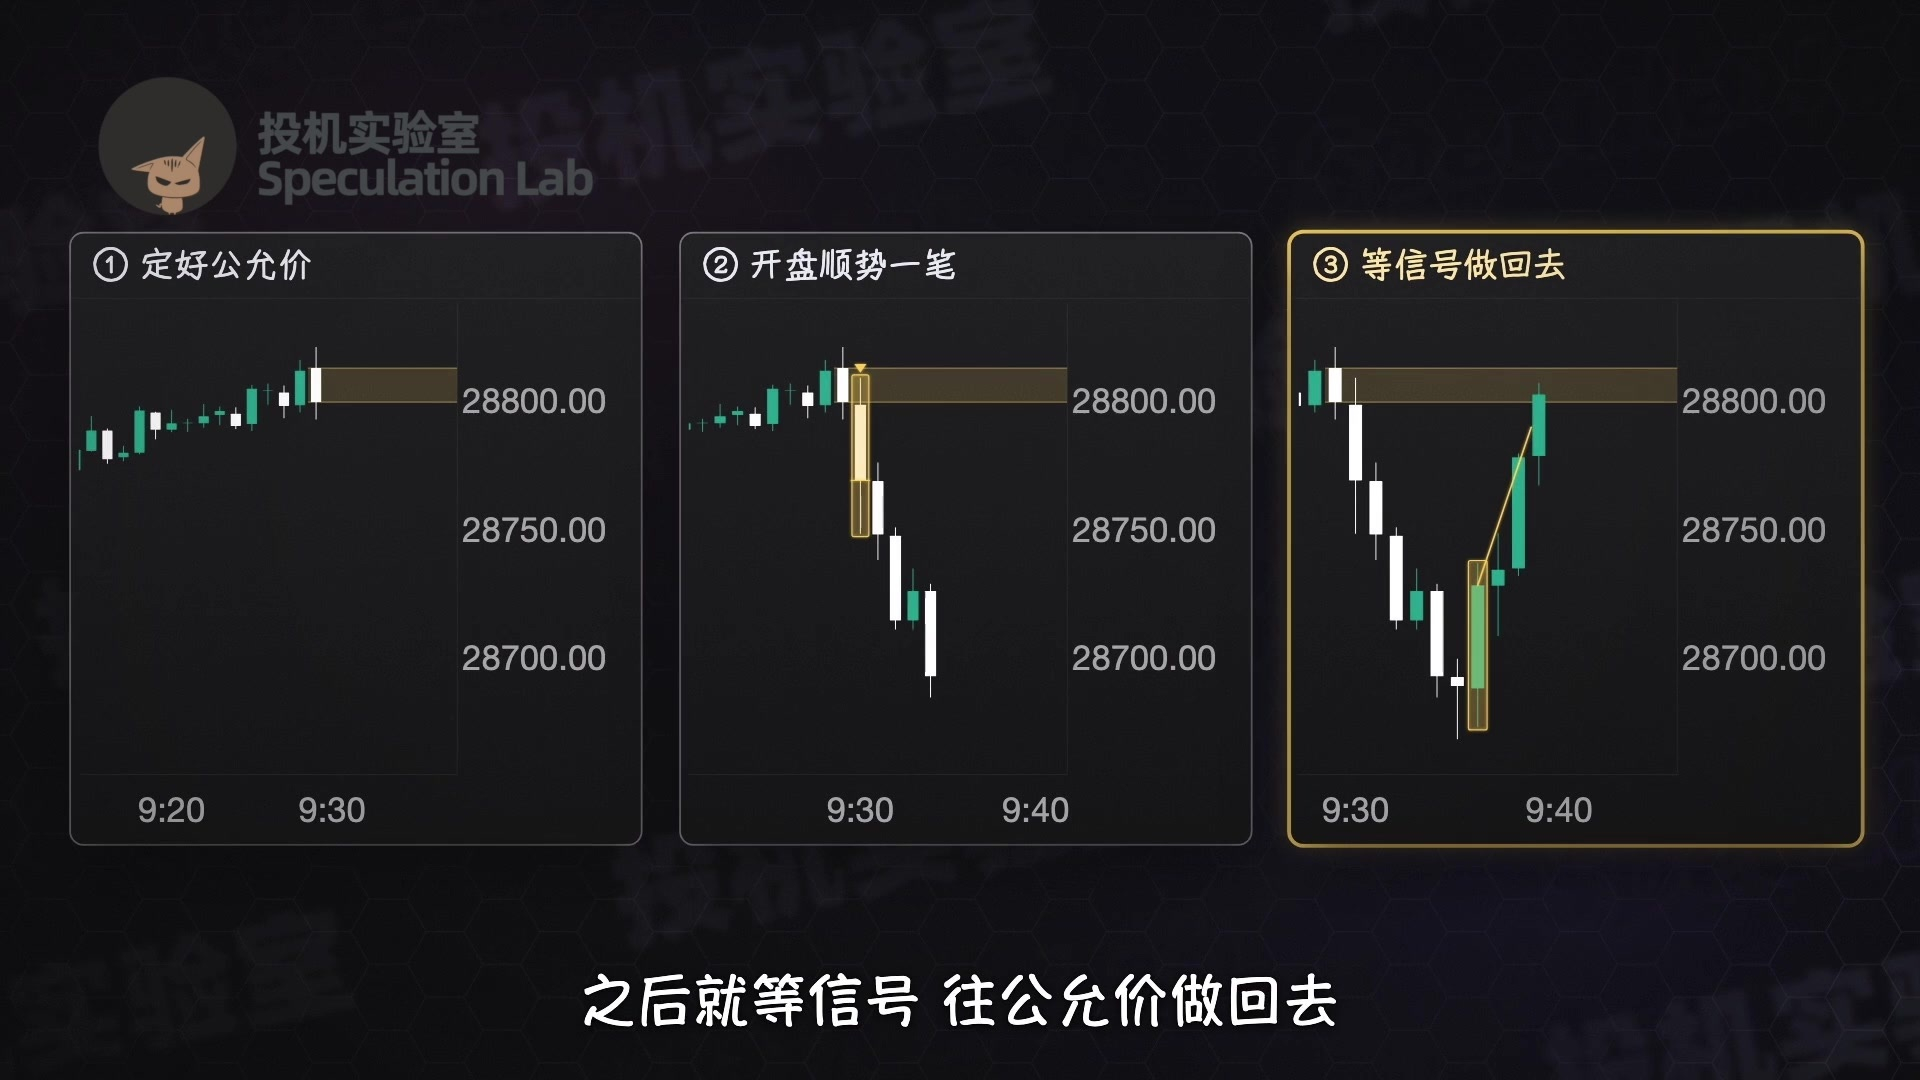
His trading logic is that after a big wave of buy or sell orders pushes the price away, sooner or later it will return to a fair price. For example, when the New York market opens at 9:30 a.m., orders accumulated overnight and orders from large institutions flood in together, and the initial move often overshoots.
He calls the price at the moment the market opens fair value, meaning a fair price. The farther the price moves away, the more he can make by trading back toward it.
So he uses the same approach in every session: first determine fair value, then place a trade in the direction of the opening move, and after that wait for a signal to trade back toward fair value.
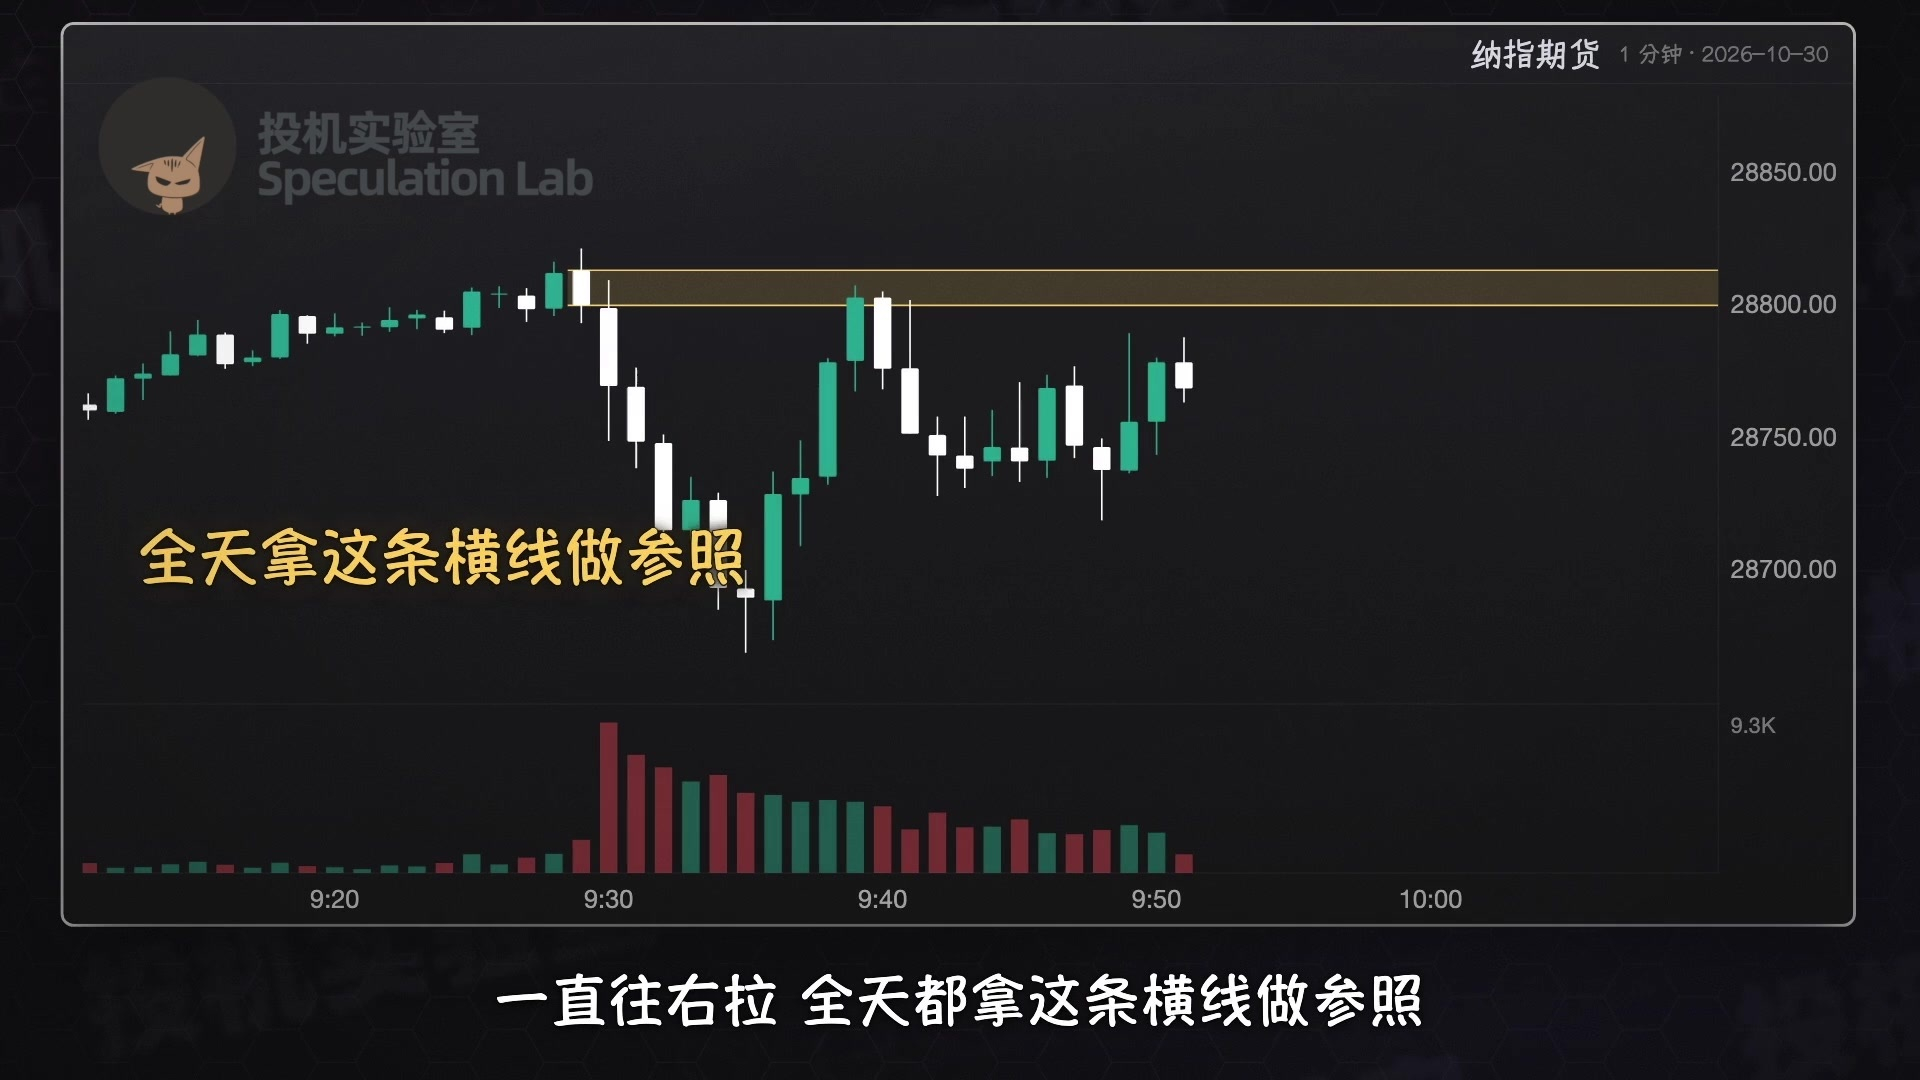
First, how does he determine fair value? On an ordinary day, he uses the 9:30 opening price. He marks the 9:29 candlestick, the last one-minute candle before the open, and extends it to the right. He uses that horizontal line as a reference for the rest of the day.
If, after the open, the price immediately moves back into the range where it had been consolidating for a long time before the open, he switches to using that range instead.
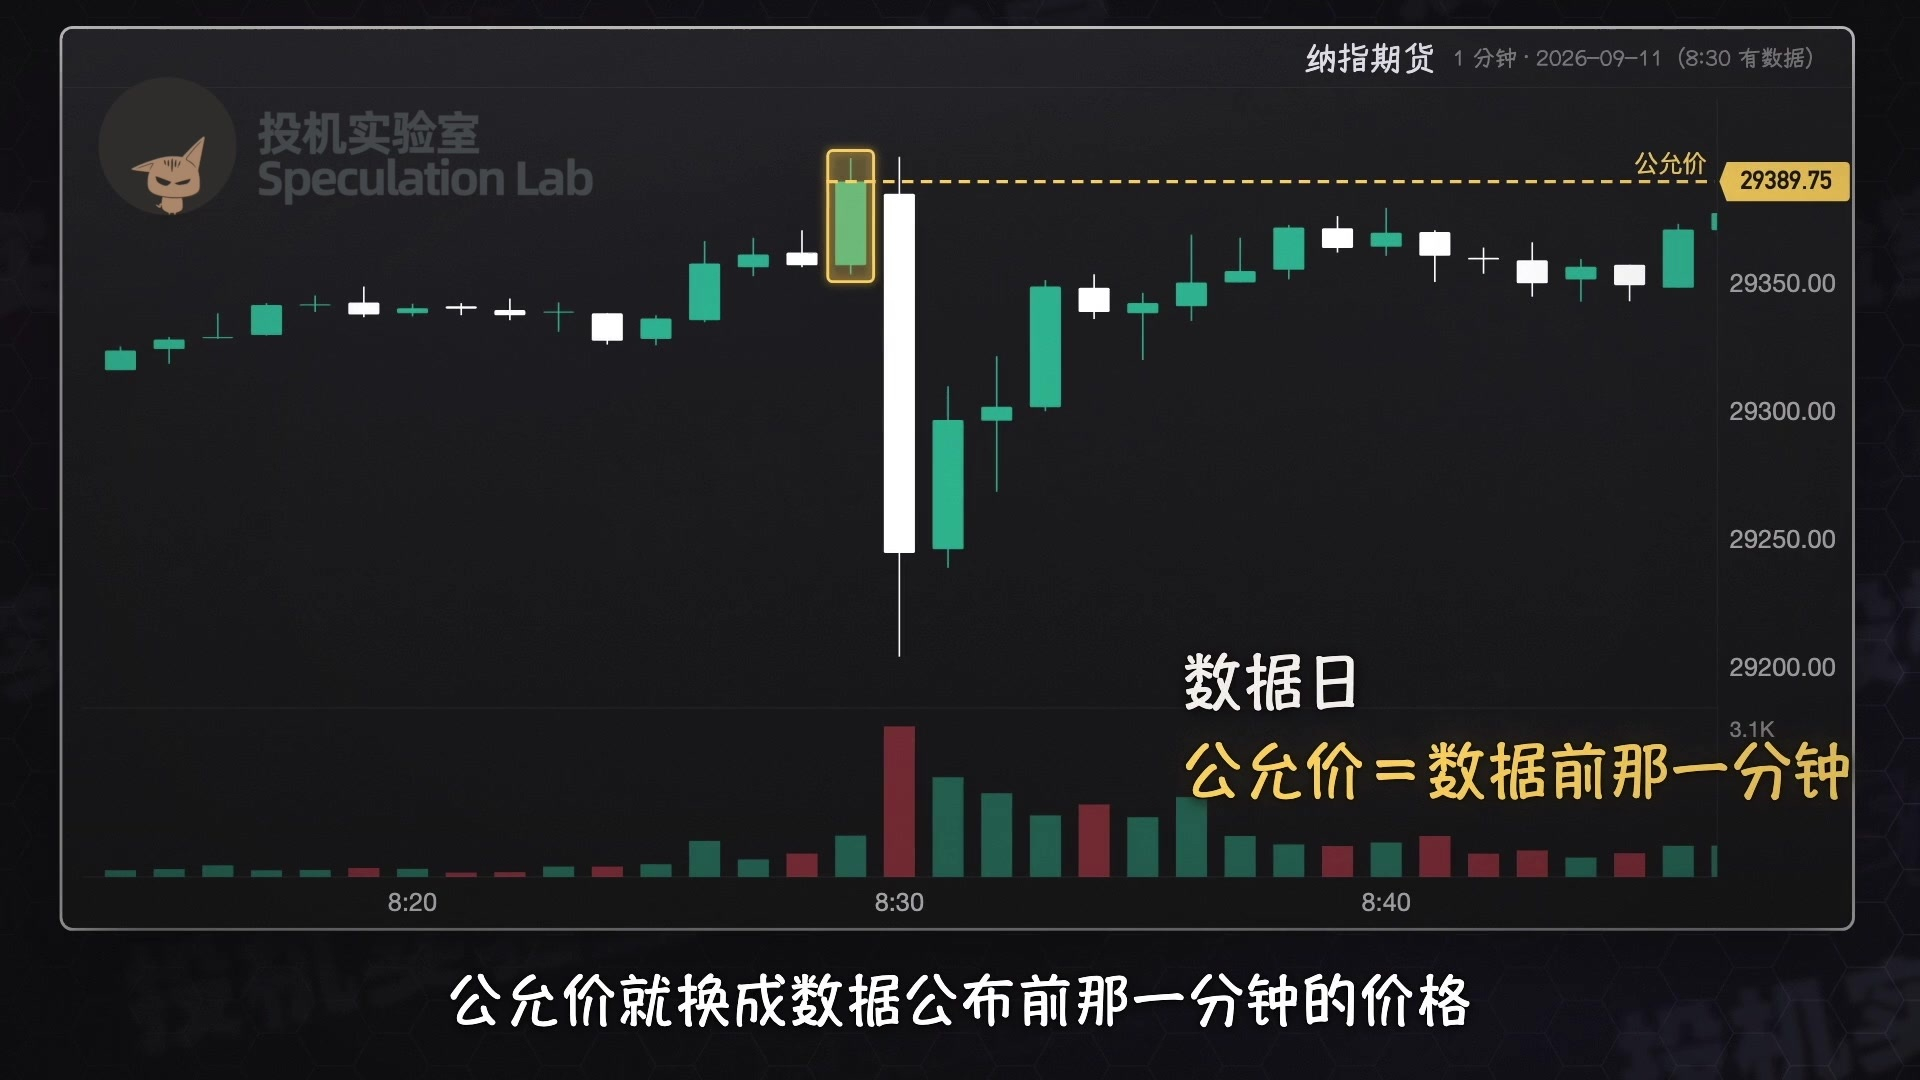
On some days, important data is released at 8:30 a.m., such as inflation figures like CPI or PPI. The release times are scheduled in advance. On those days, he uses the price from the minute before the data release as fair value.
His reasoning is that everyone is already expecting this data, and the price has already priced it in. The big candle that forms when the data comes out is an overreaction.
If, at 9:30, the price suddenly returns to the pre-data price, he ignores the opening price and focuses only on the price from before the data release.
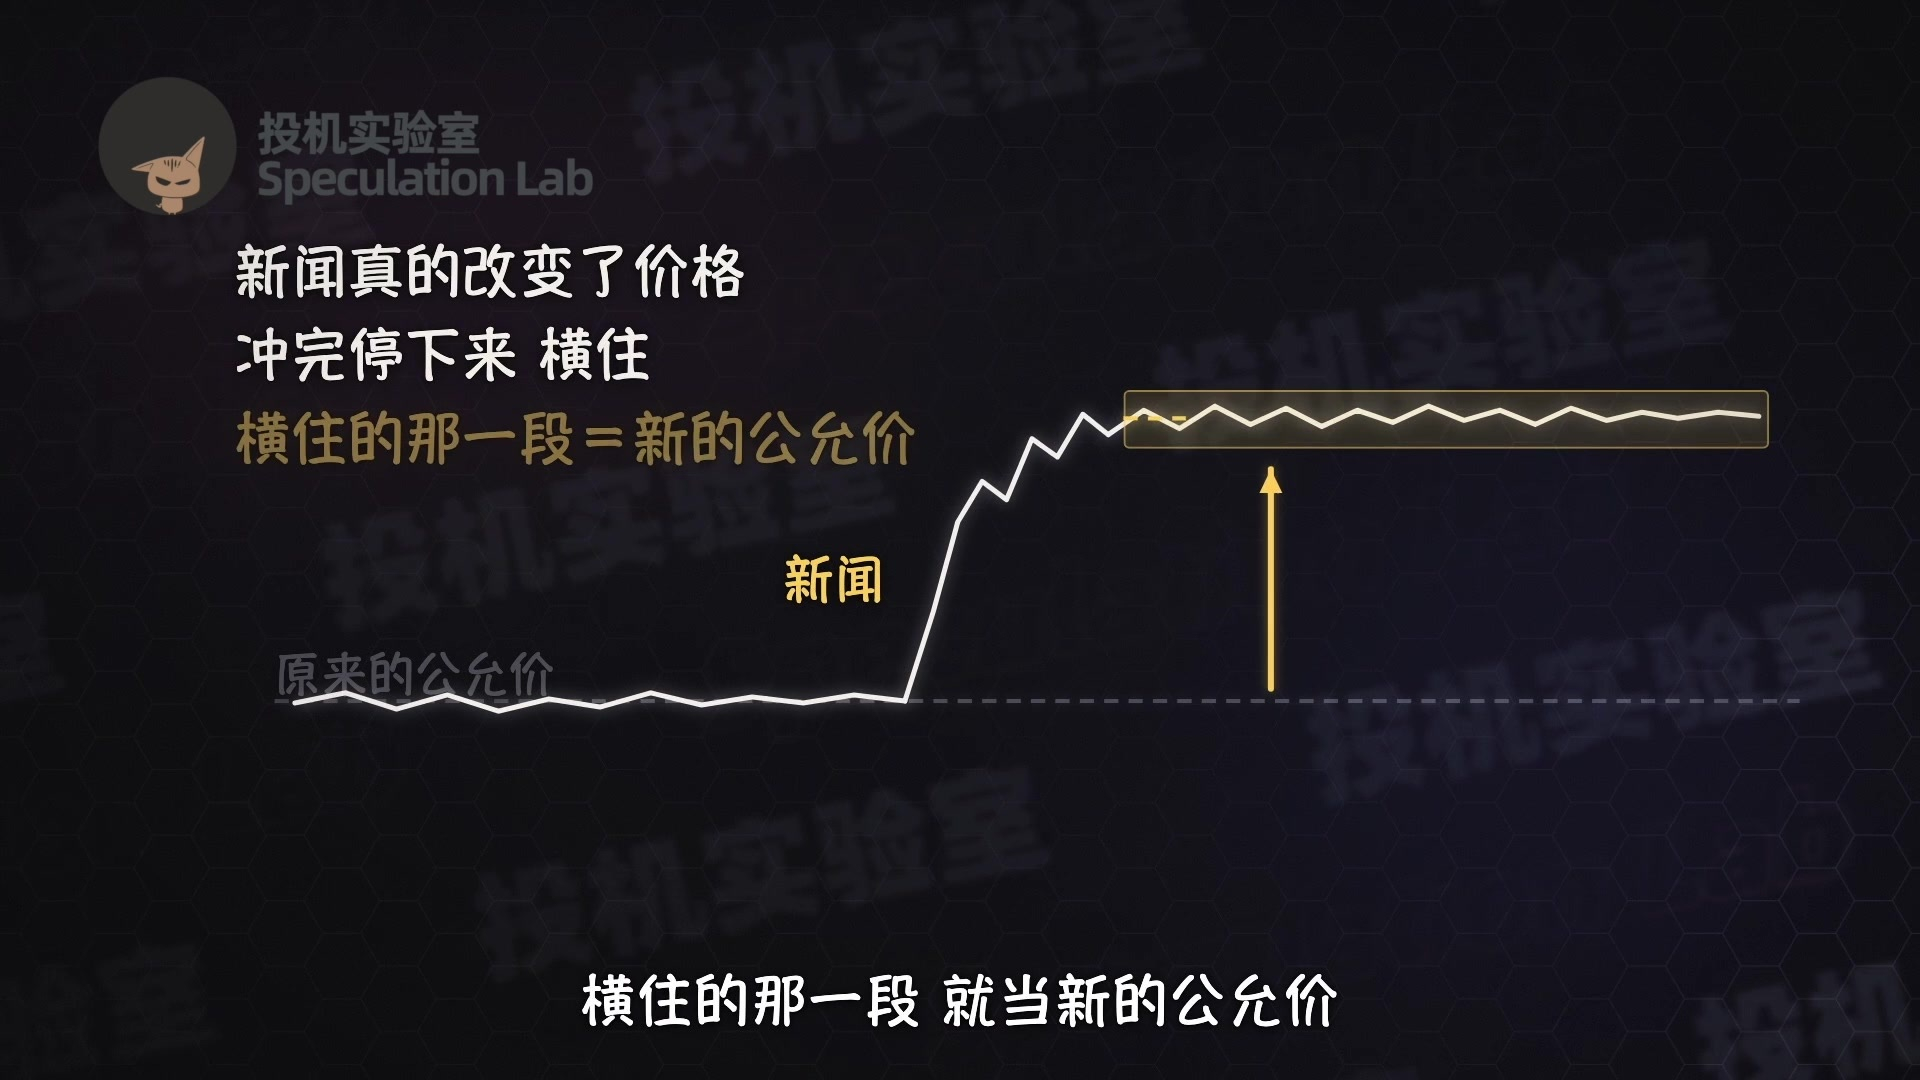
Another situation is unexpected breaking news, such as Trump suddenly posting something or the Fed chair unexpectedly speaking. This kind of news really can change prices, so fair value changes too.
Once the price has finished surging and settles into sideways movement for a while, he treats that consolidation range as the new fair value.
Once fair value is set, he places an opening trade in the direction of the move.
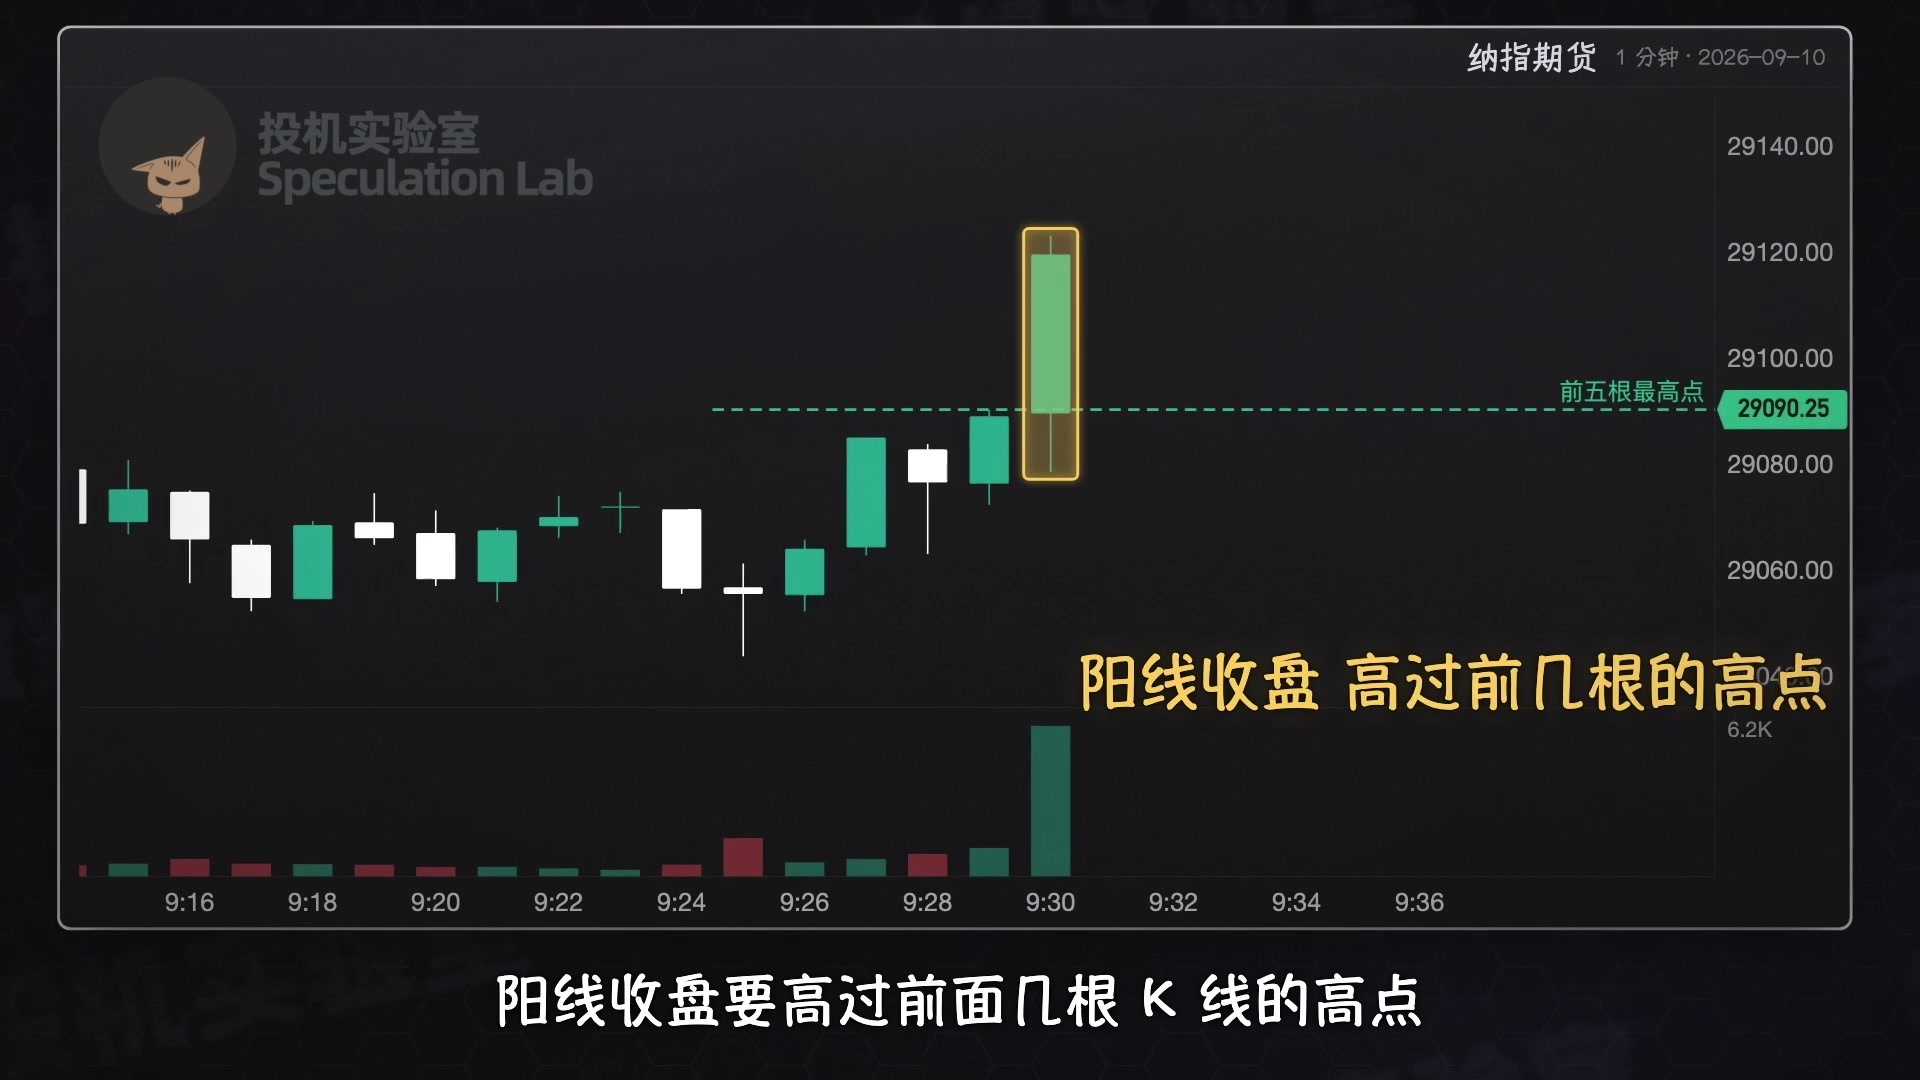
Look at the first candlestick after the 9:30 open: if it closes bullish, he goes long; if it closes bearish, he goes short. A bullish candle should close above the highs of the preceding candles, and a bearish candle should close below their lows. Ideally, the trade should also align with the broader direction.
He determines the broader direction by looking at the past 6 to 12 hours. He believes the price eventually moves back: if it has risen all night, it’s more likely to fall after the open; if it has fallen all night, it’s more likely to rise.
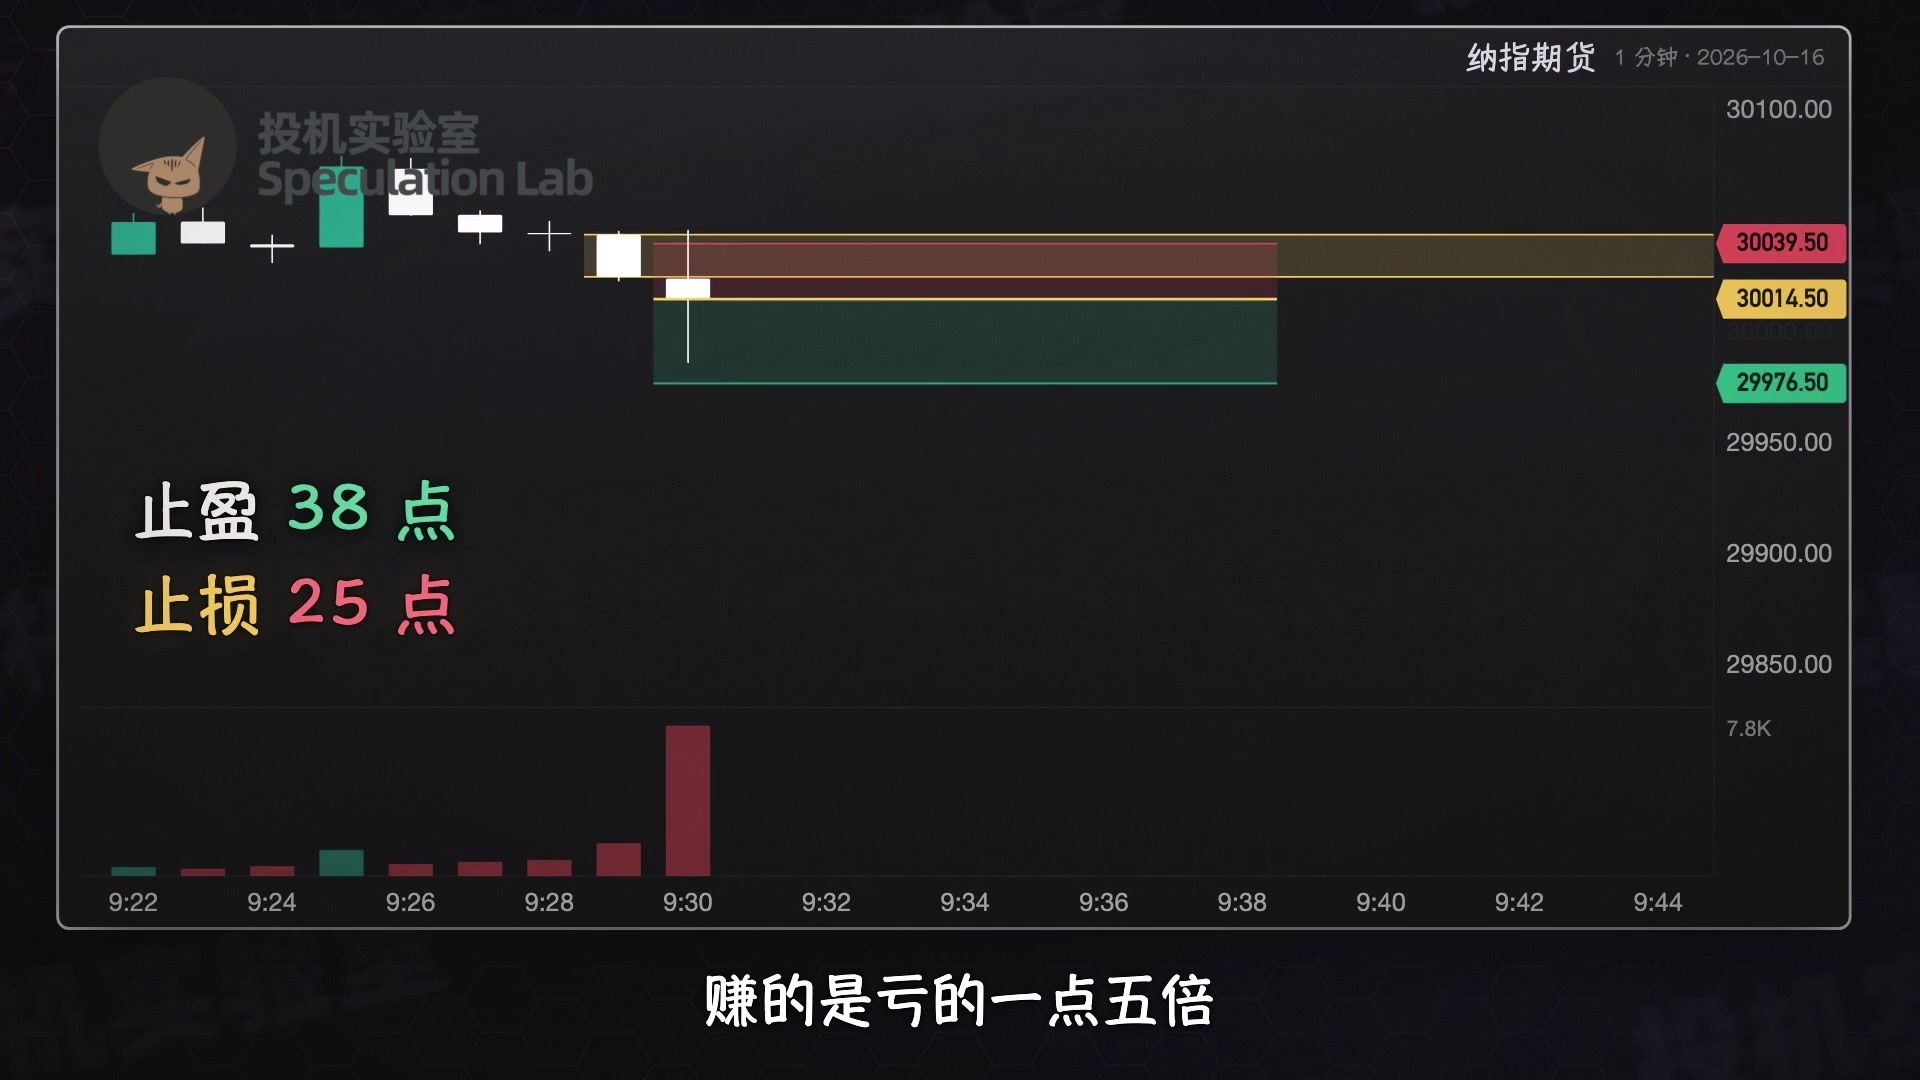
This trade has a 38-point take-profit and a 25-point stop-loss, so the profit is 1.5 times the loss. For Nasdaq futures, a one-point move is worth $20 per contract, so 25 points is $500.
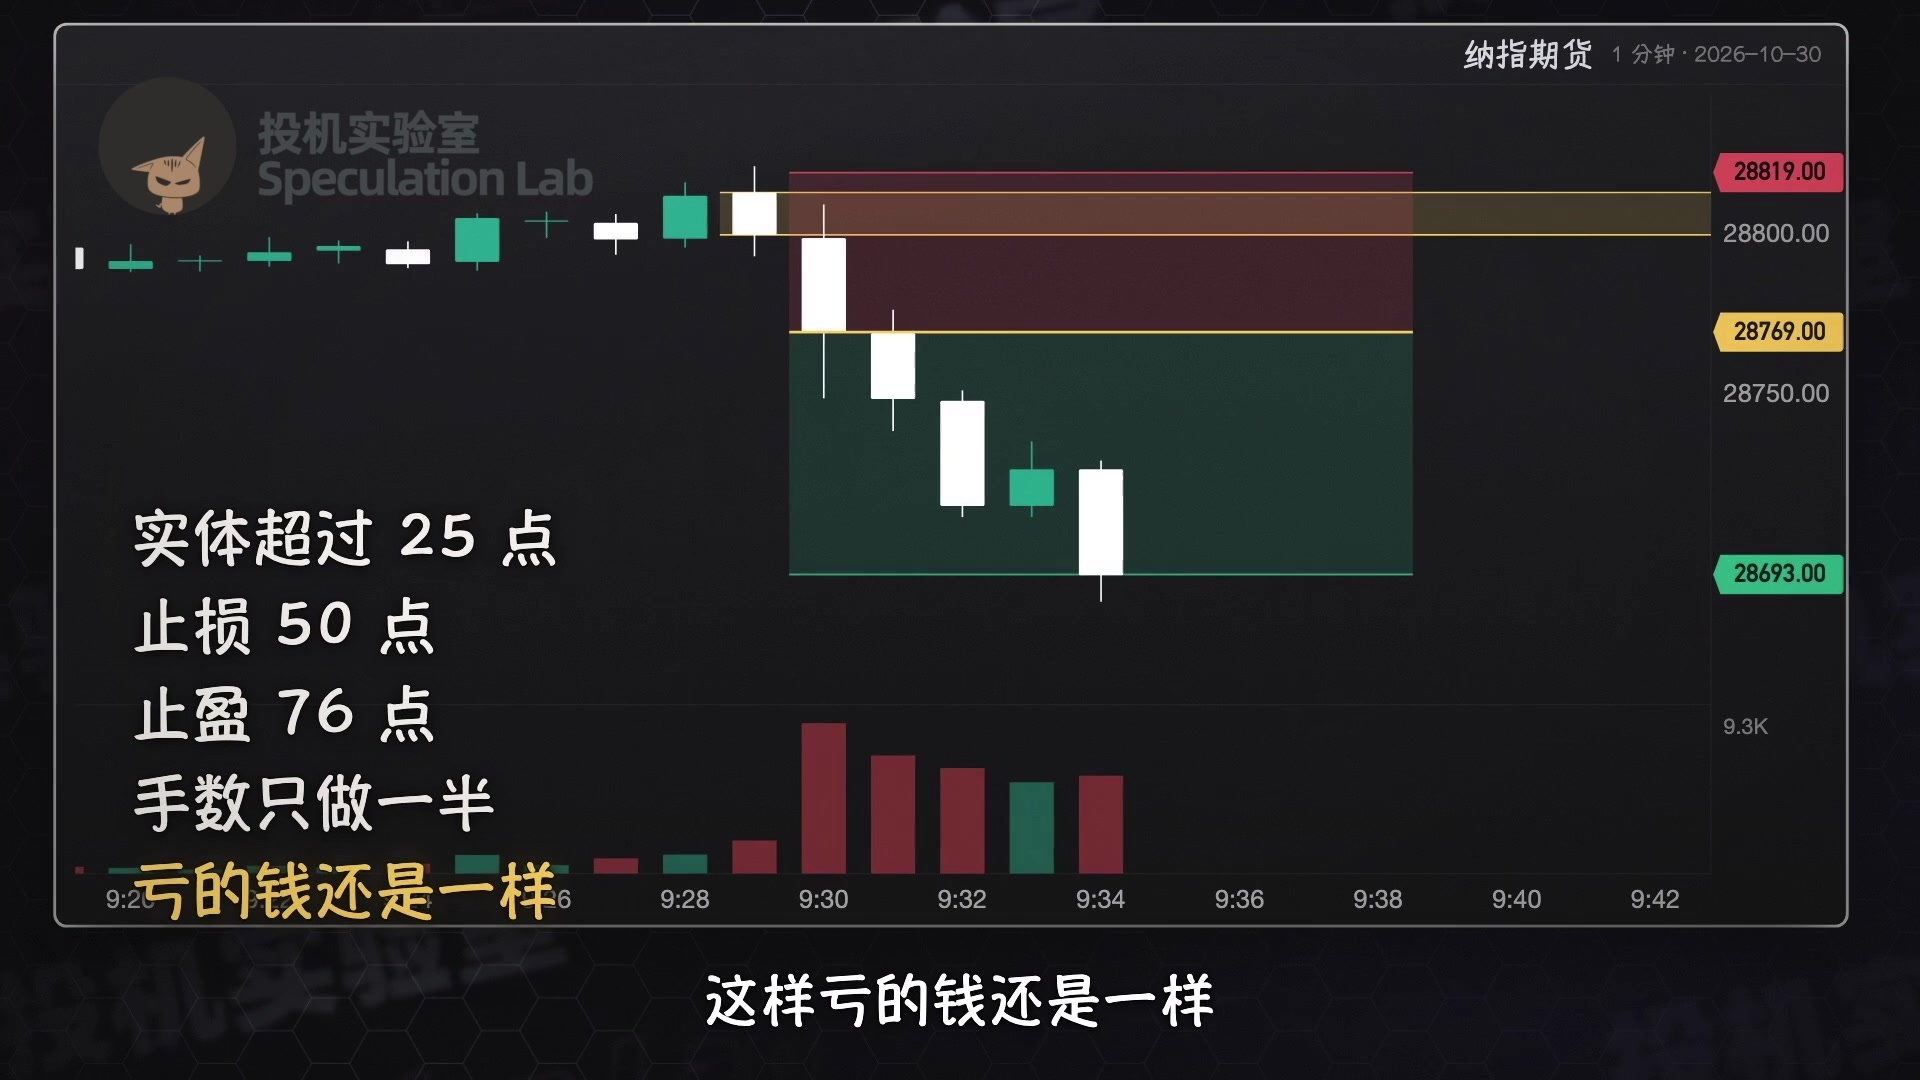
If the opening candlestick moves more than 25 points from open to close—more than the stop-loss distance—he sets the stop-loss at 50 points and the take-profit at 76 points, and trades half the usual position size. That way, the dollar amount at risk stays the same.
He only takes the opening trade in the first five minutes. After that, he stops.
Once the opening trade is done, he spends the rest of the time trading back toward fair value: if the price is above fair value, he waits for a short signal; if it’s below, he waits for a long signal. There are only two types of signals, and he waits for the candle to finish and close before counting either one.
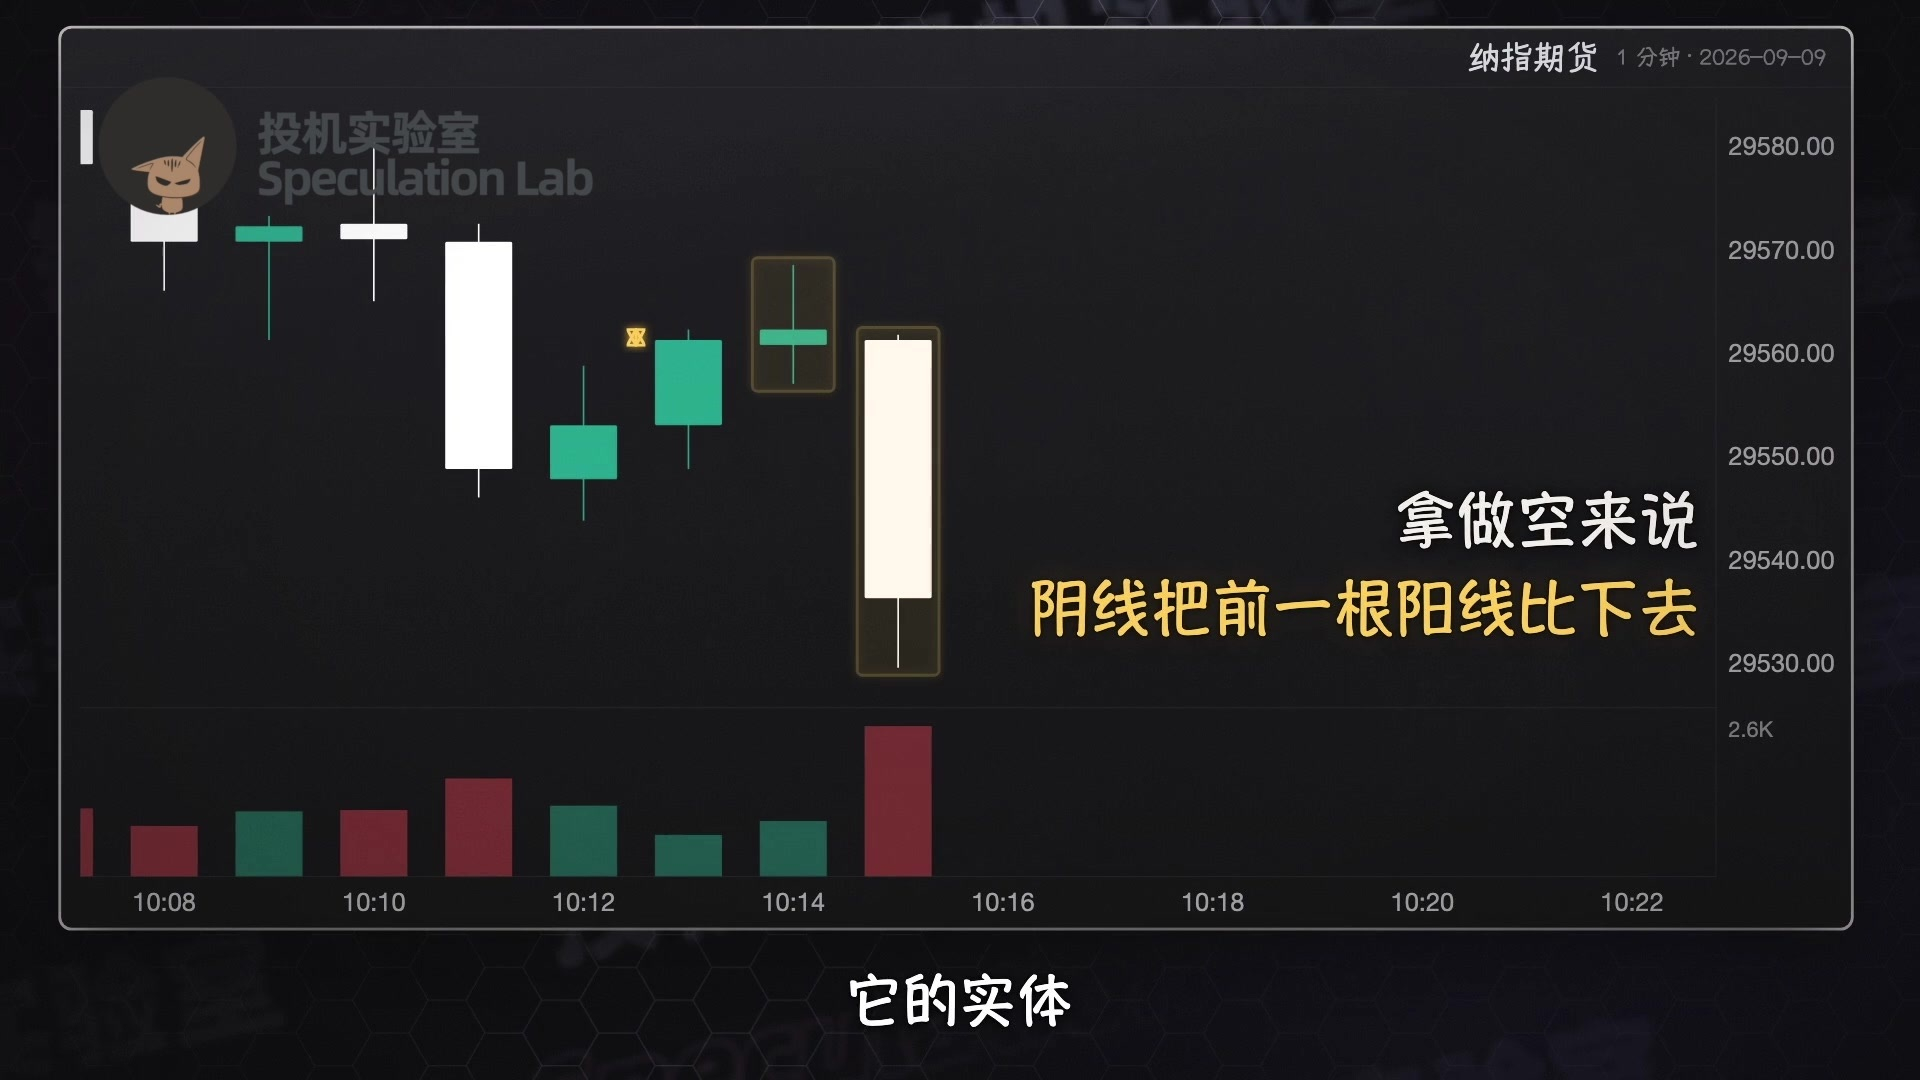
The first is called a displacement candle. For a short trade, a bearish candle has to overpower the previous bullish candle: its body—the thick part between the open and close—must be longer than the previous bullish candle’s body, and it must close below that candle’s low. Two consecutive bearish candles that together overpower a bullish candle also count.
The second type is a structure break.
As the price moves up, it leaves a series of minor lows. A minor low is the low of a candle that’s lower than the lows of the candles on either side of it. If a candle later closes below that minor low, it shows the upward move is running out of steam, and he can go short.
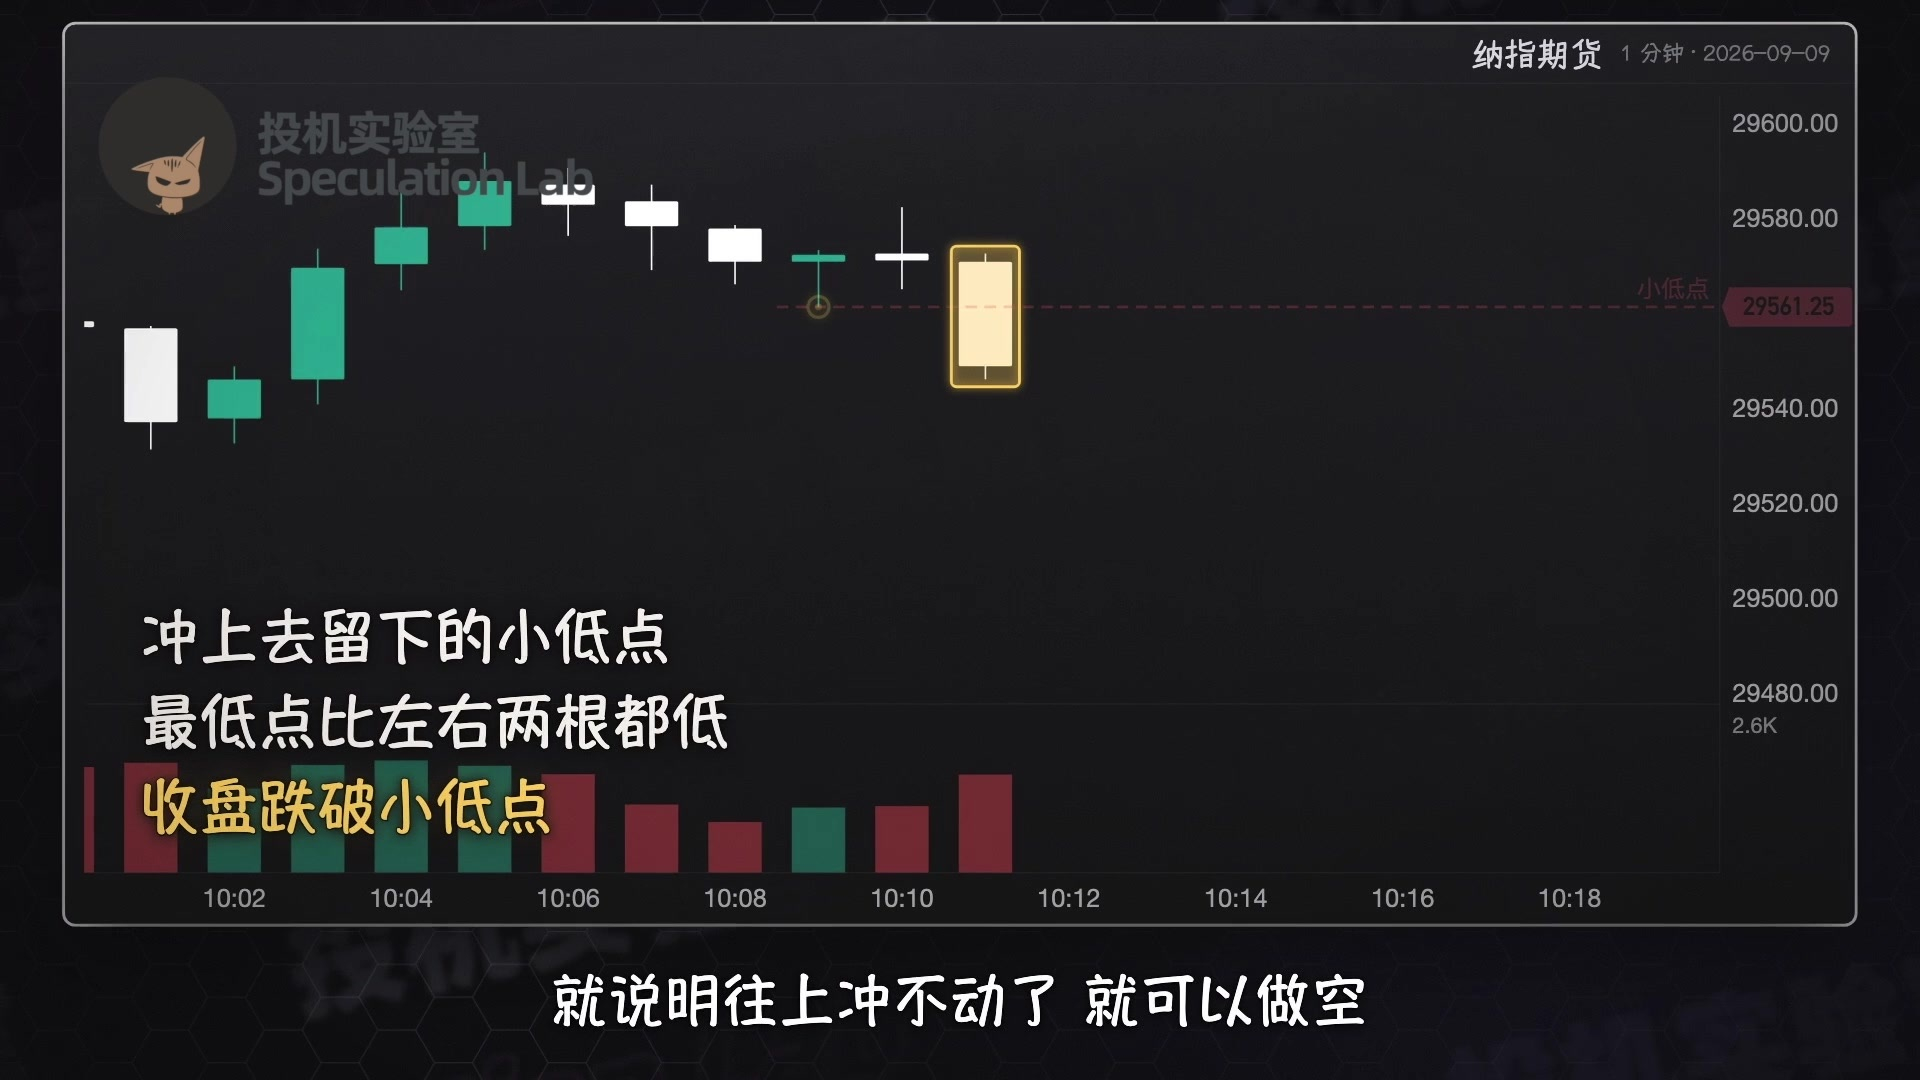
If the price has tested that minor low several times without breaking it, a break below it is more reliable. He thinks structure breaks are more dependable than displacement candles. Long signals work the same way, but in reverse.
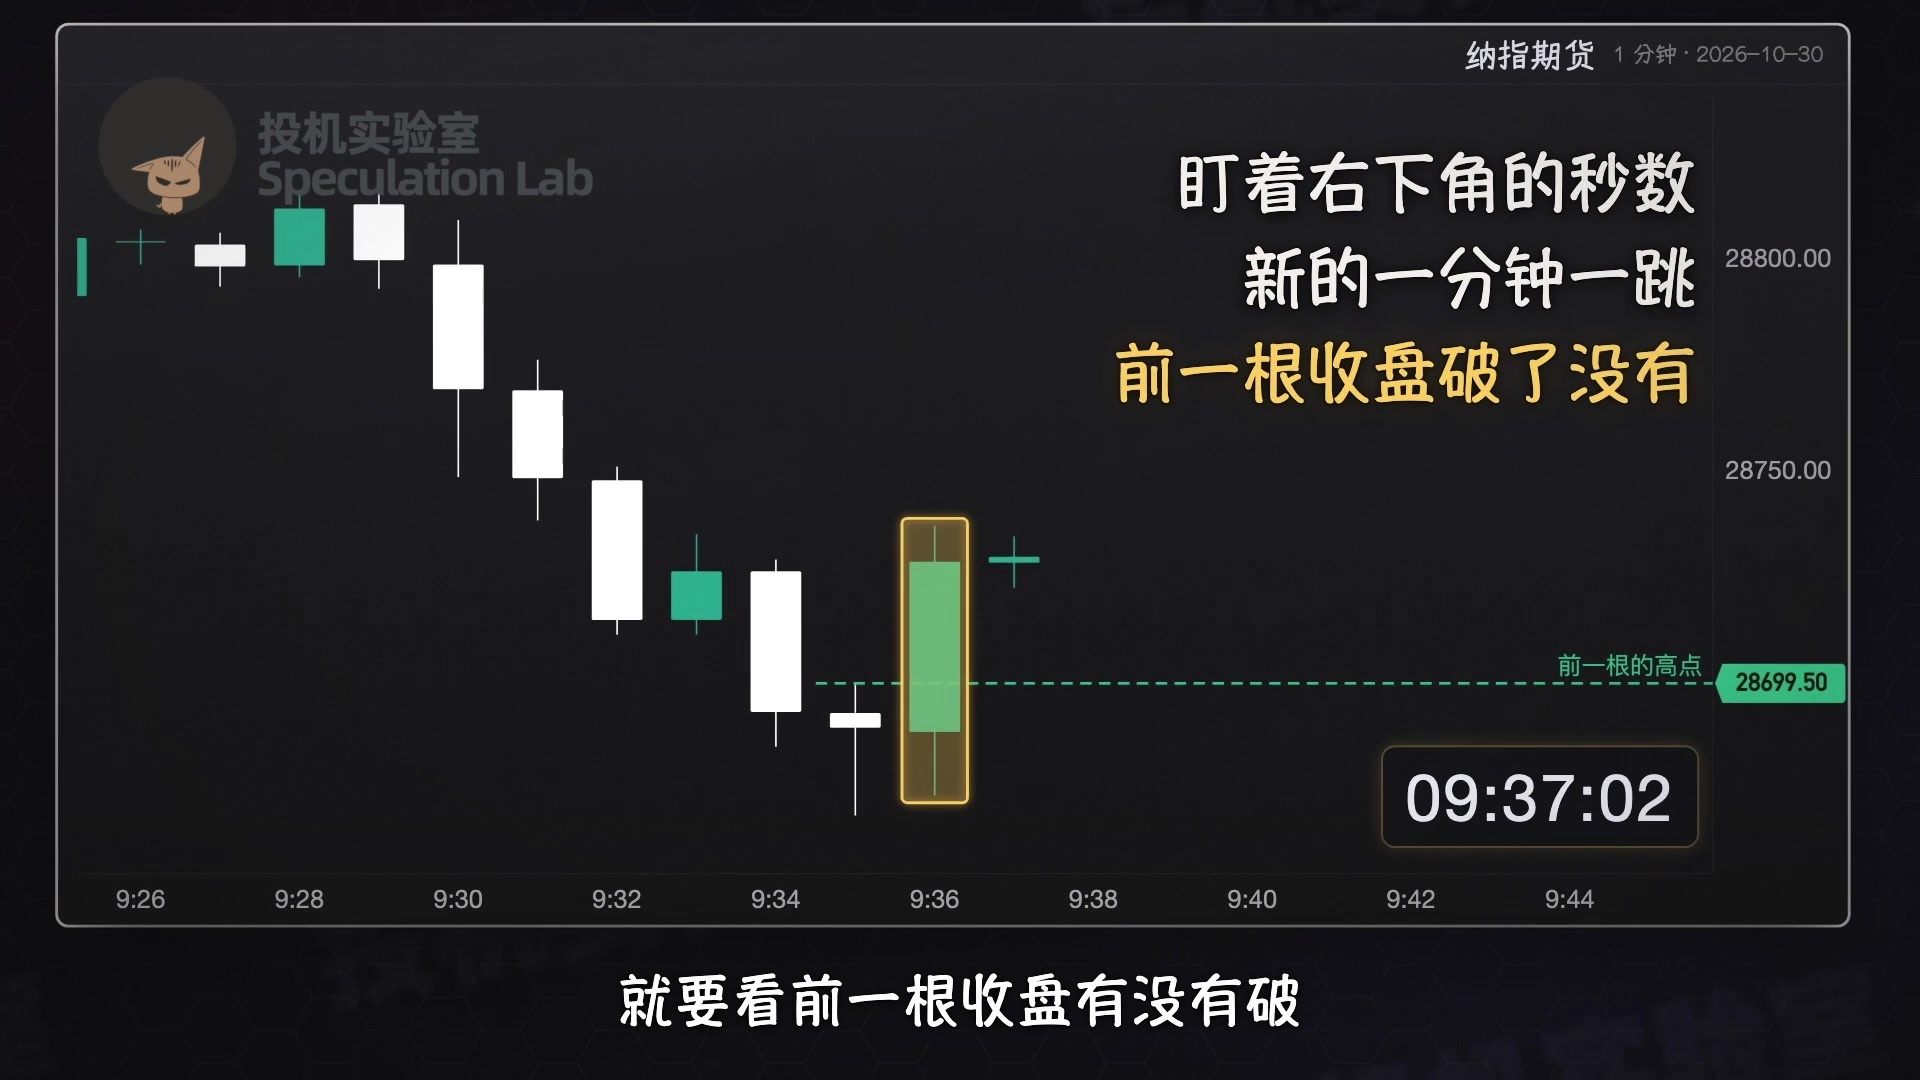
When he trades, he watches the seconds in the lower-right corner of the screen. As soon as a new minute starts, he checks whether the previous candle closed through the level. If it did, he enters immediately.
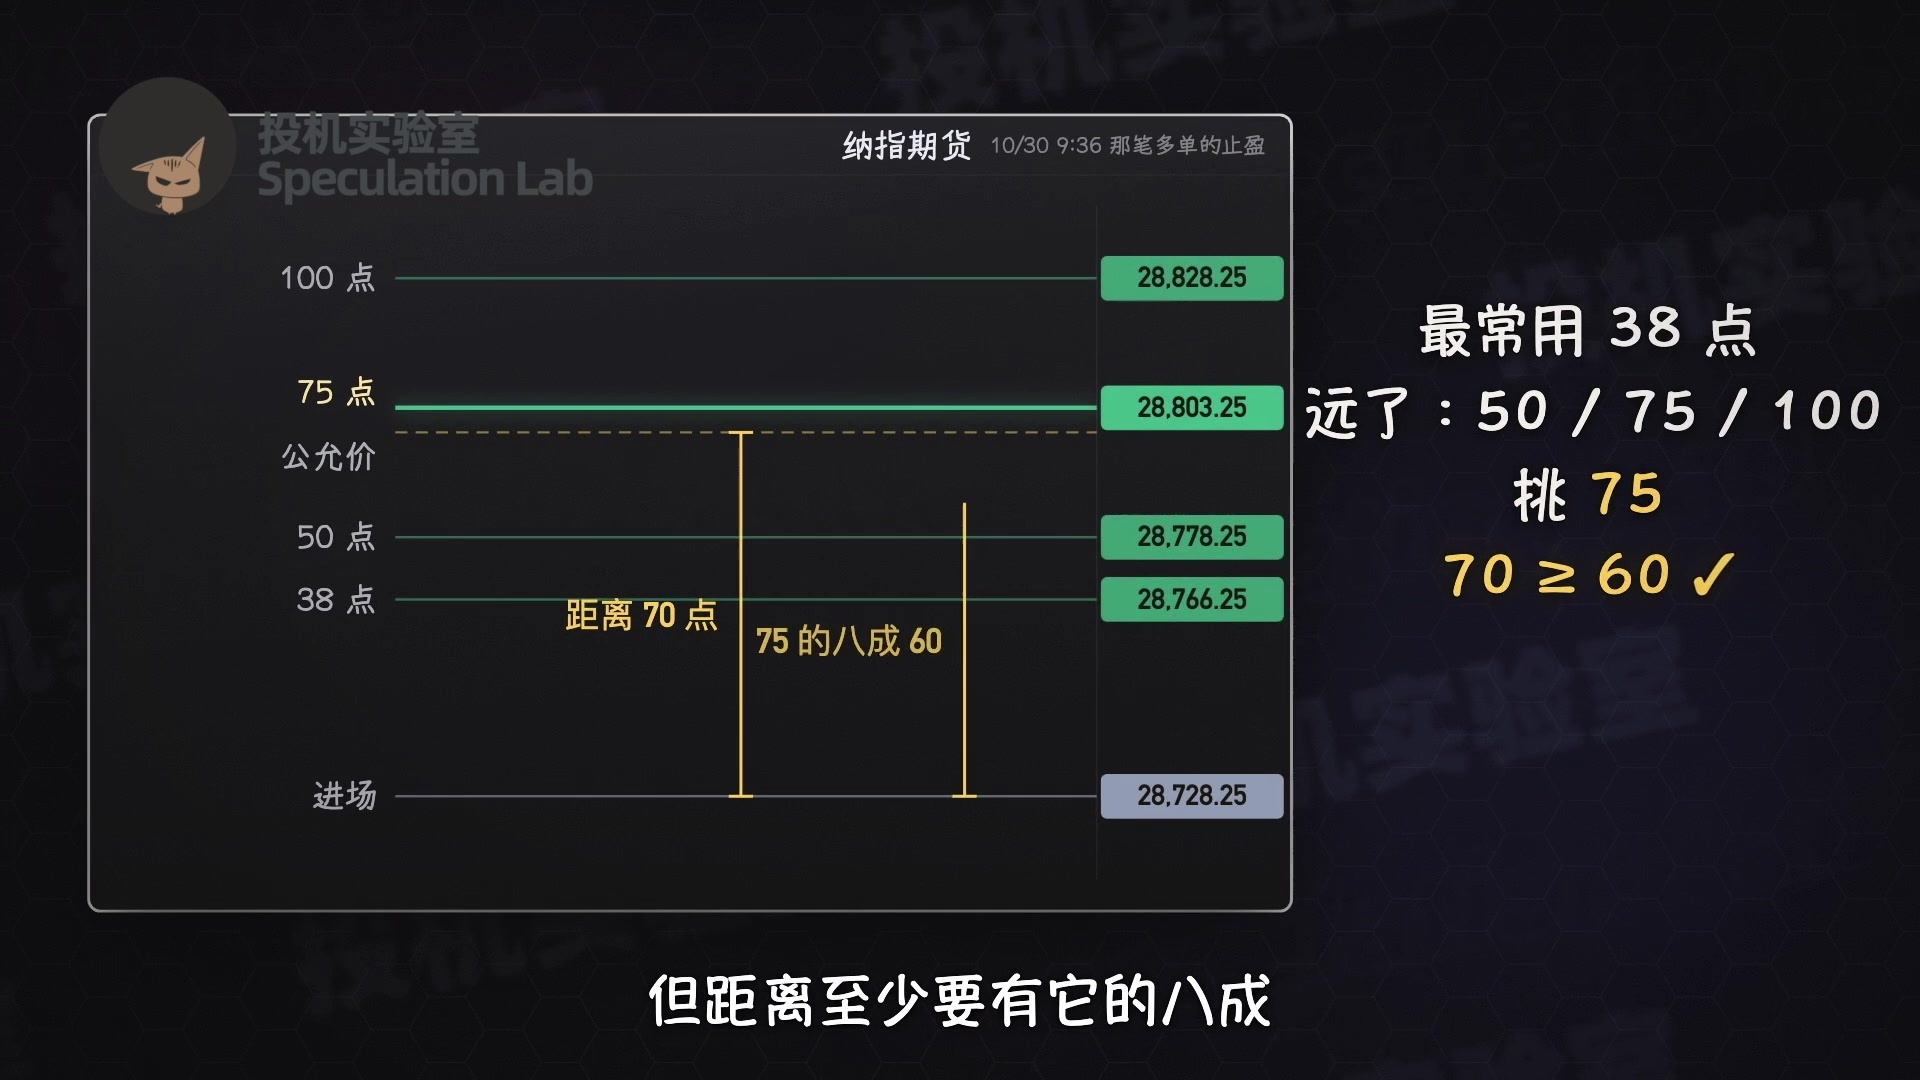
He trades back toward fair value, but still uses a fixed number of points for his take-profit. First he measures how far the price is from fair value, then picks a point target close to that distance.
He most often uses 38 points. If the price is farther away, he sets it at 50, 75, or 100 points. The target can be a little larger than the distance, but the distance must be at least 80% of the target.
For example, if you want to make 38 points, the price needs to be at least 30 points away from fair value. Once it passes fair value, what happens next is entirely down to luck.
He doesn’t place his stop-loss at chart highs or lows. He uses a fixed number of points—usually 25, 37.5, 50, or 75. During the New York open, the stop-loss can’t be less than 25 points.
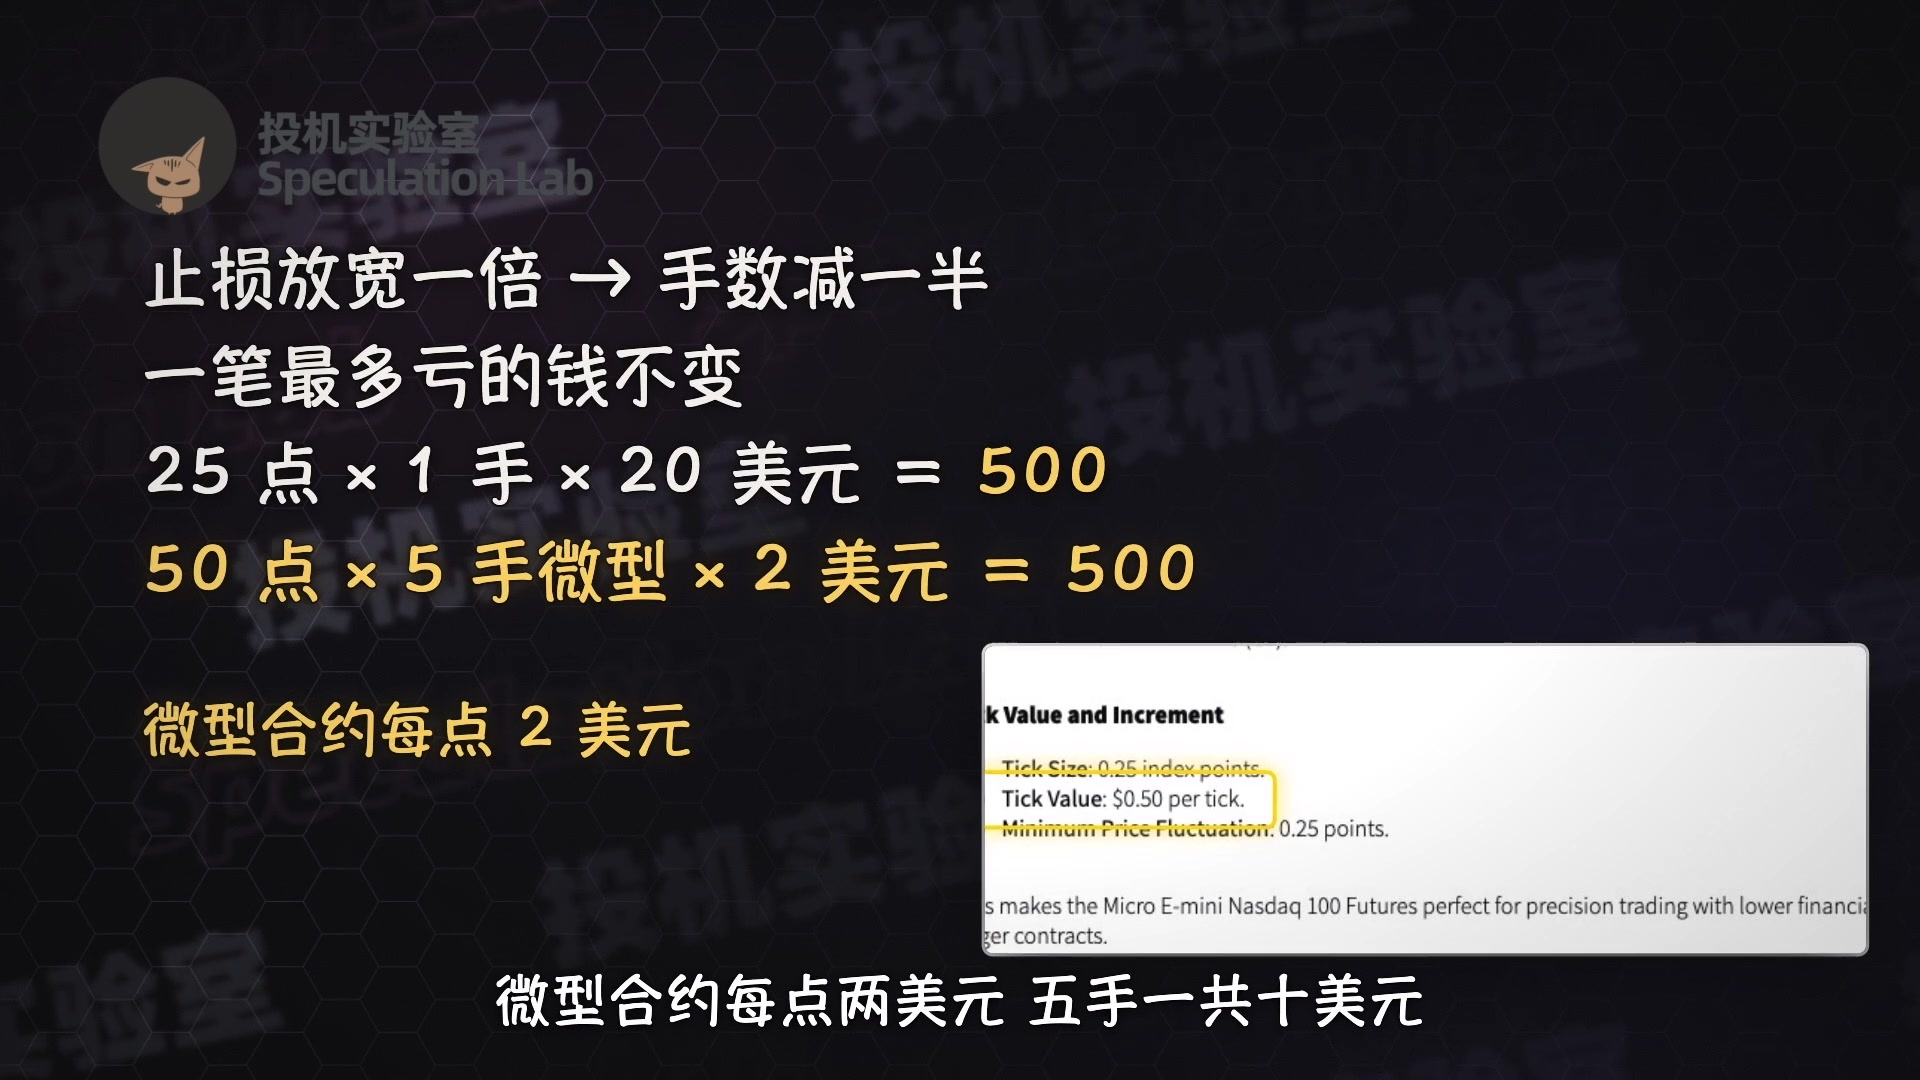
If he doubles the stop-loss, he halves the position size, so the maximum amount he can lose on a trade stays the same. For example, with a 25-point stop, one contract would lose $500. With a 50-point stop, he’d switch to five micro contracts. Each micro contract is worth $2 per point, so five are worth $10 per point, and the loss is still $500.
His favorite setup is a reversion after major economic data is released. There are usually two such releases a week.
When the 8:30 data comes out, it produces one or several huge candlesticks. He doesn’t chase those big candles. He waits for a displacement candle or a structure break, then trades back toward the price from before the data release.
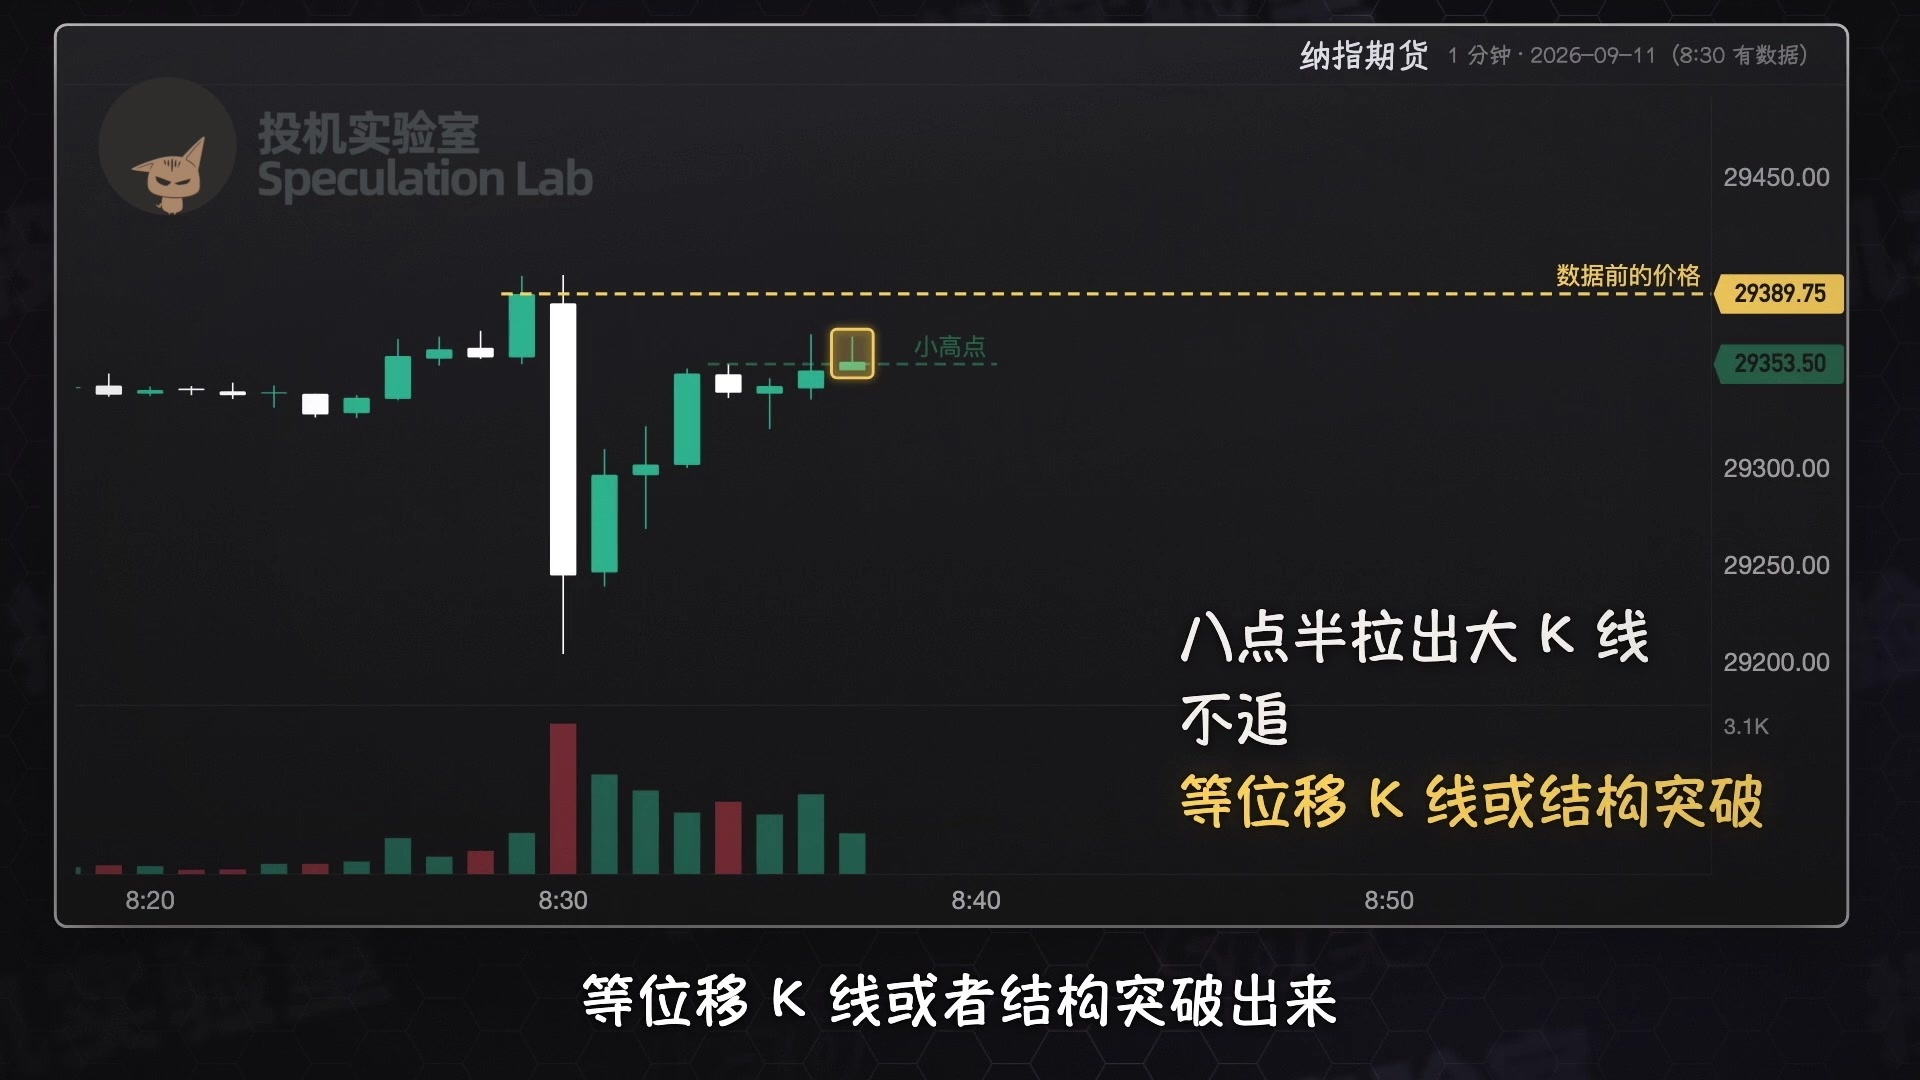
If the data is way off from what everyone expected, the price may keep moving in one direction, with no sign of a reversal. In that case, he doesn’t trade.
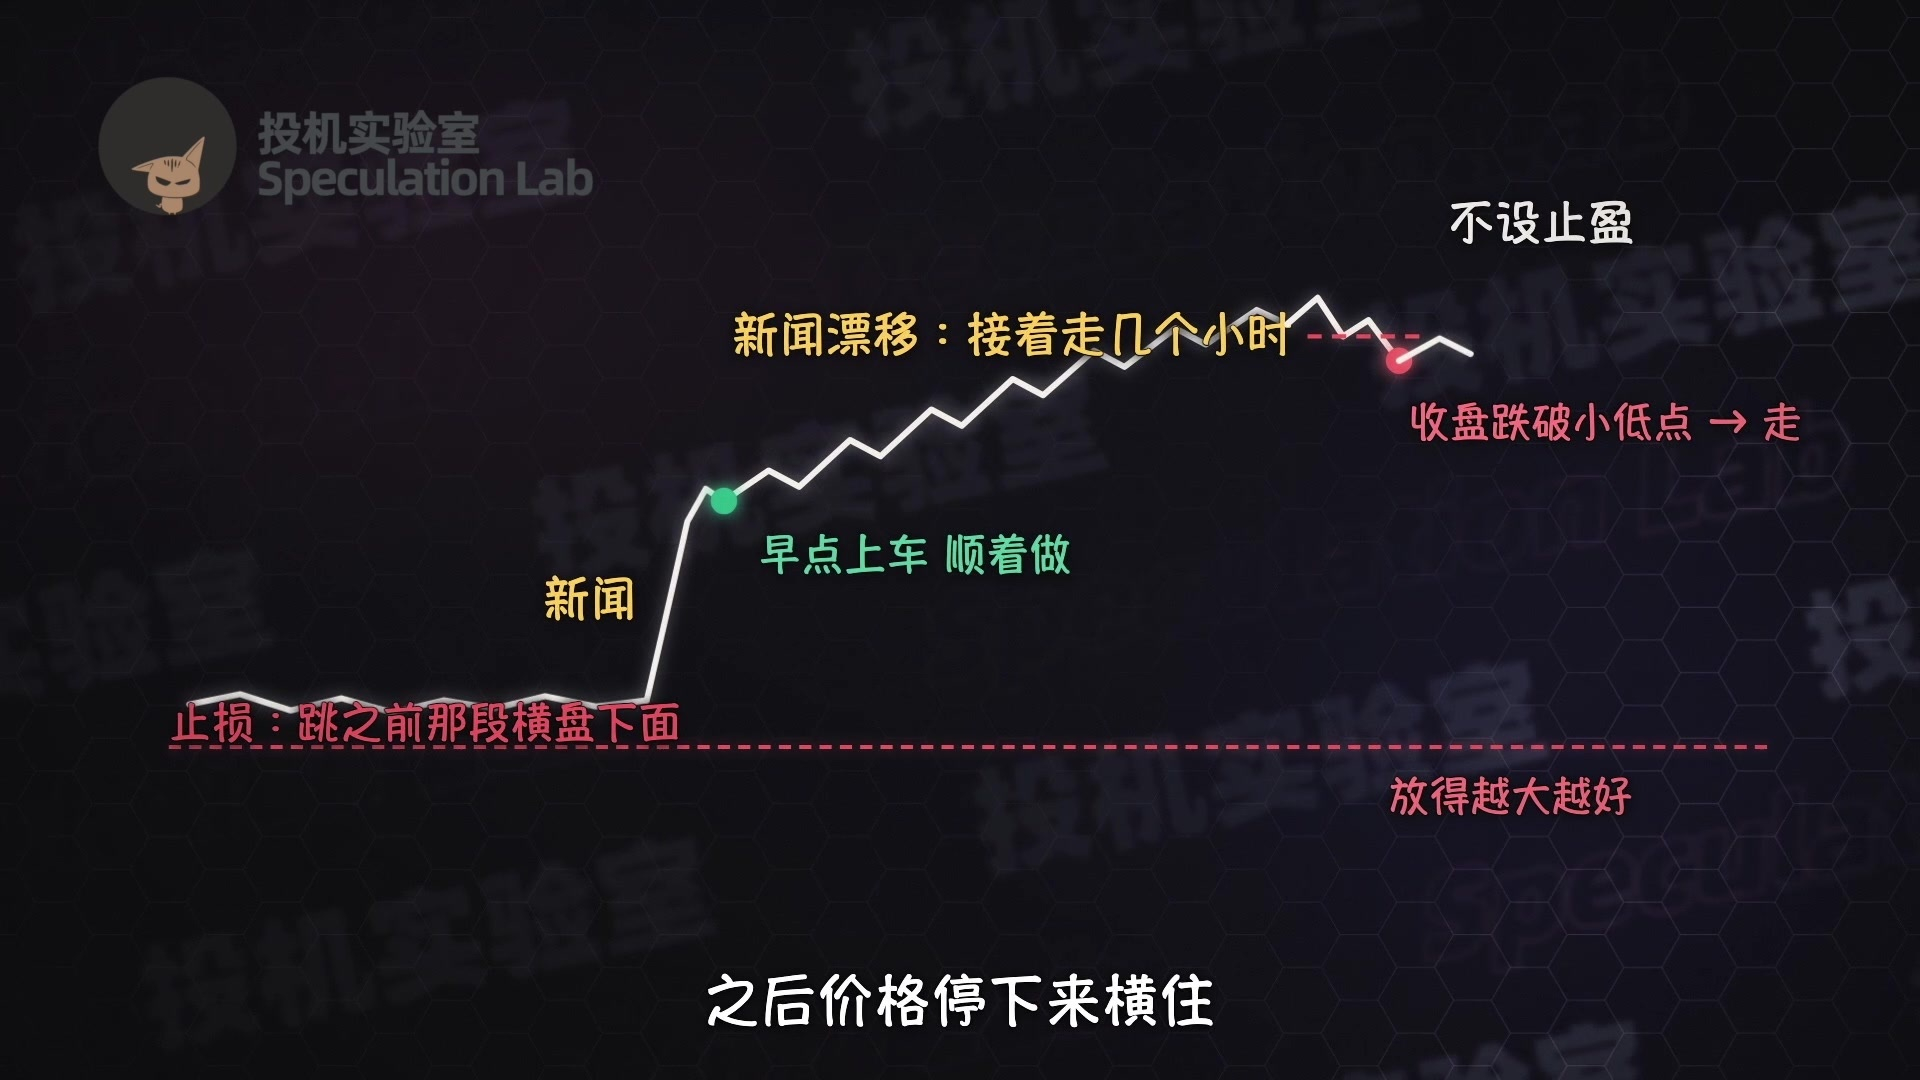
Unexpected news is the opposite: the price may keep moving in the direction of the news for several hours. This is called news drift. If he sees the price suddenly jump, he gets in as early as he can and trades in that direction.
He puts the stop below the consolidation range before the jump, and the wider the better. He doesn’t set a take-profit either. He exits when the price turns and closes below the previous minor low. After that, once the price stalls and consolidates, he trades back toward this new range.
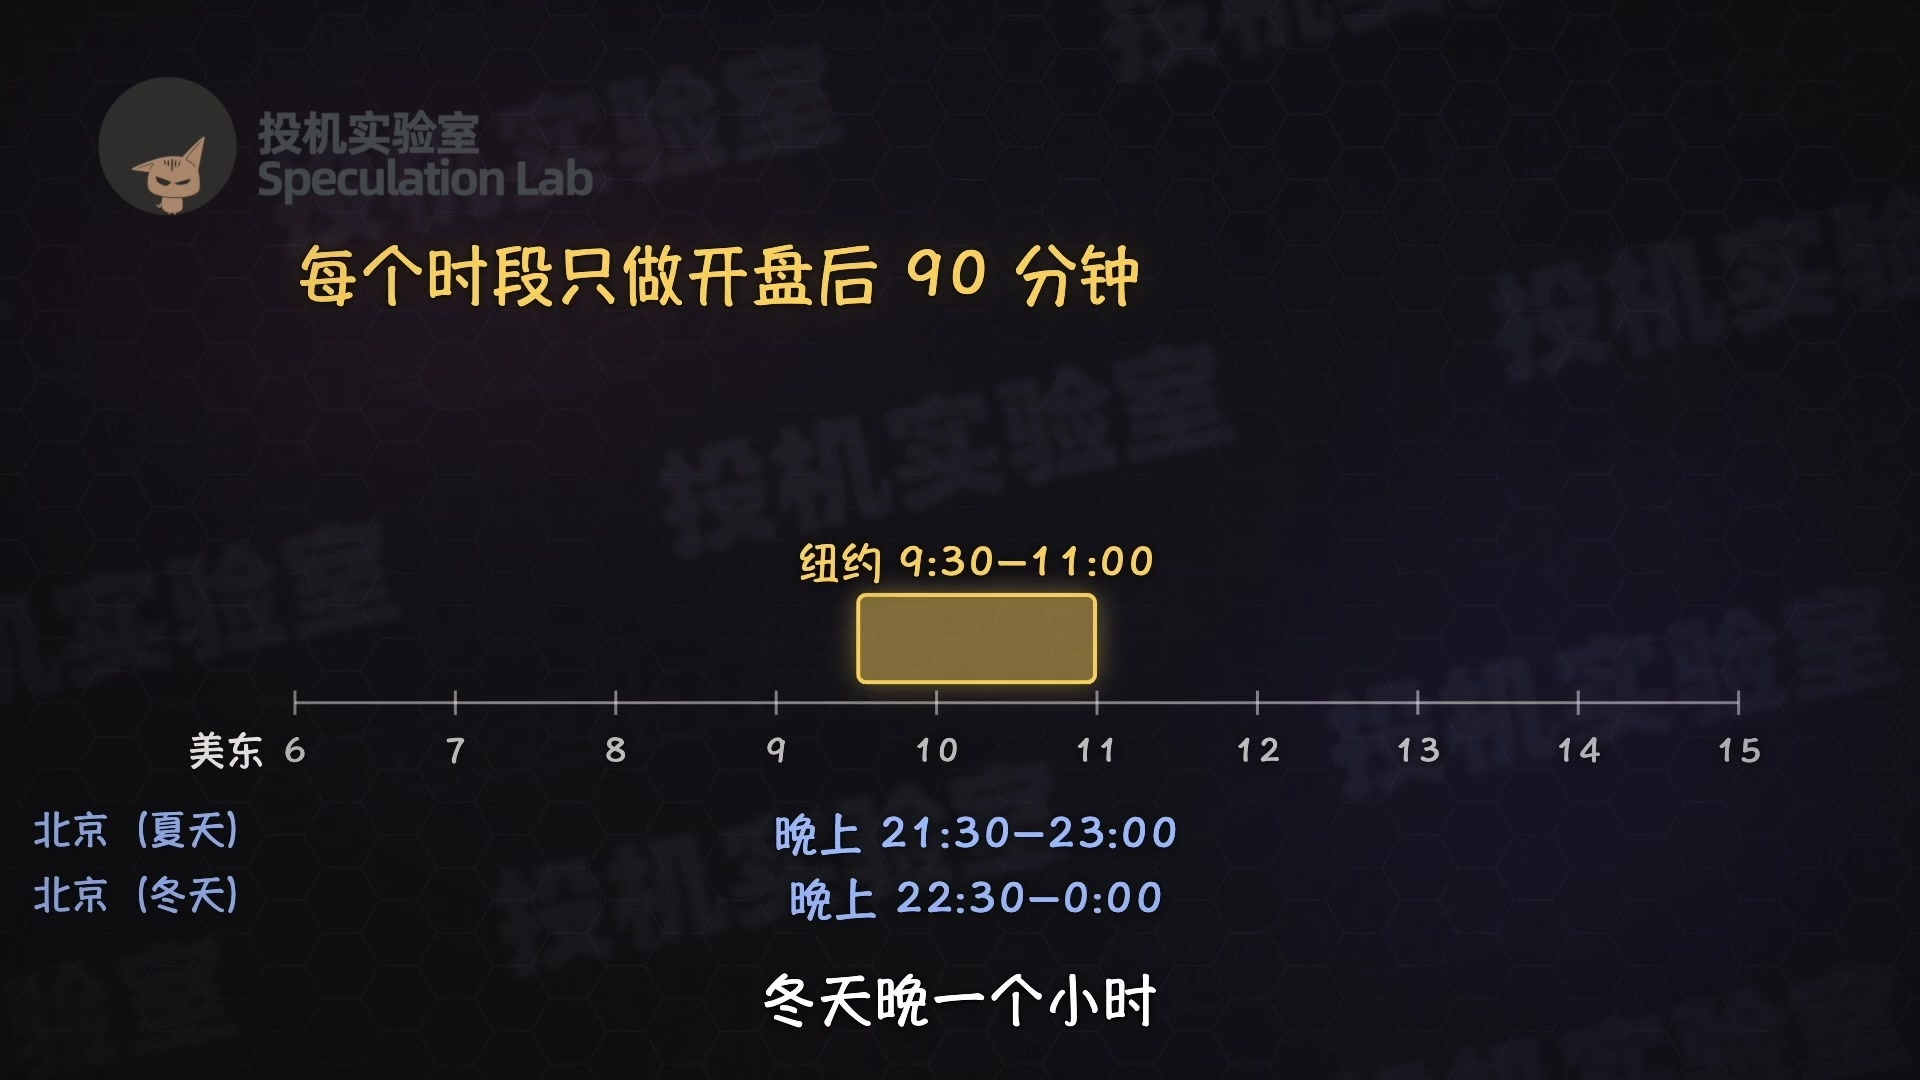
He only trades the first 90 minutes after the open of each session. For New York, that’s 9:30 to 11:00 a.m. In Beijing time, it’s 9:30 to 11:00 p.m. in summer, and an hour later in winter.
After 11:00, the 9:30 price can no longer be used as a target. Between 11:00 a.m. and 2:00 p.m., there’s usually little volume, so he doesn’t trade. At 2:00 p.m. Eastern, when futures reopen, and at 6:00 p.m. and 8:00 p.m., when the Asian session opens, he starts over with a new session each time.
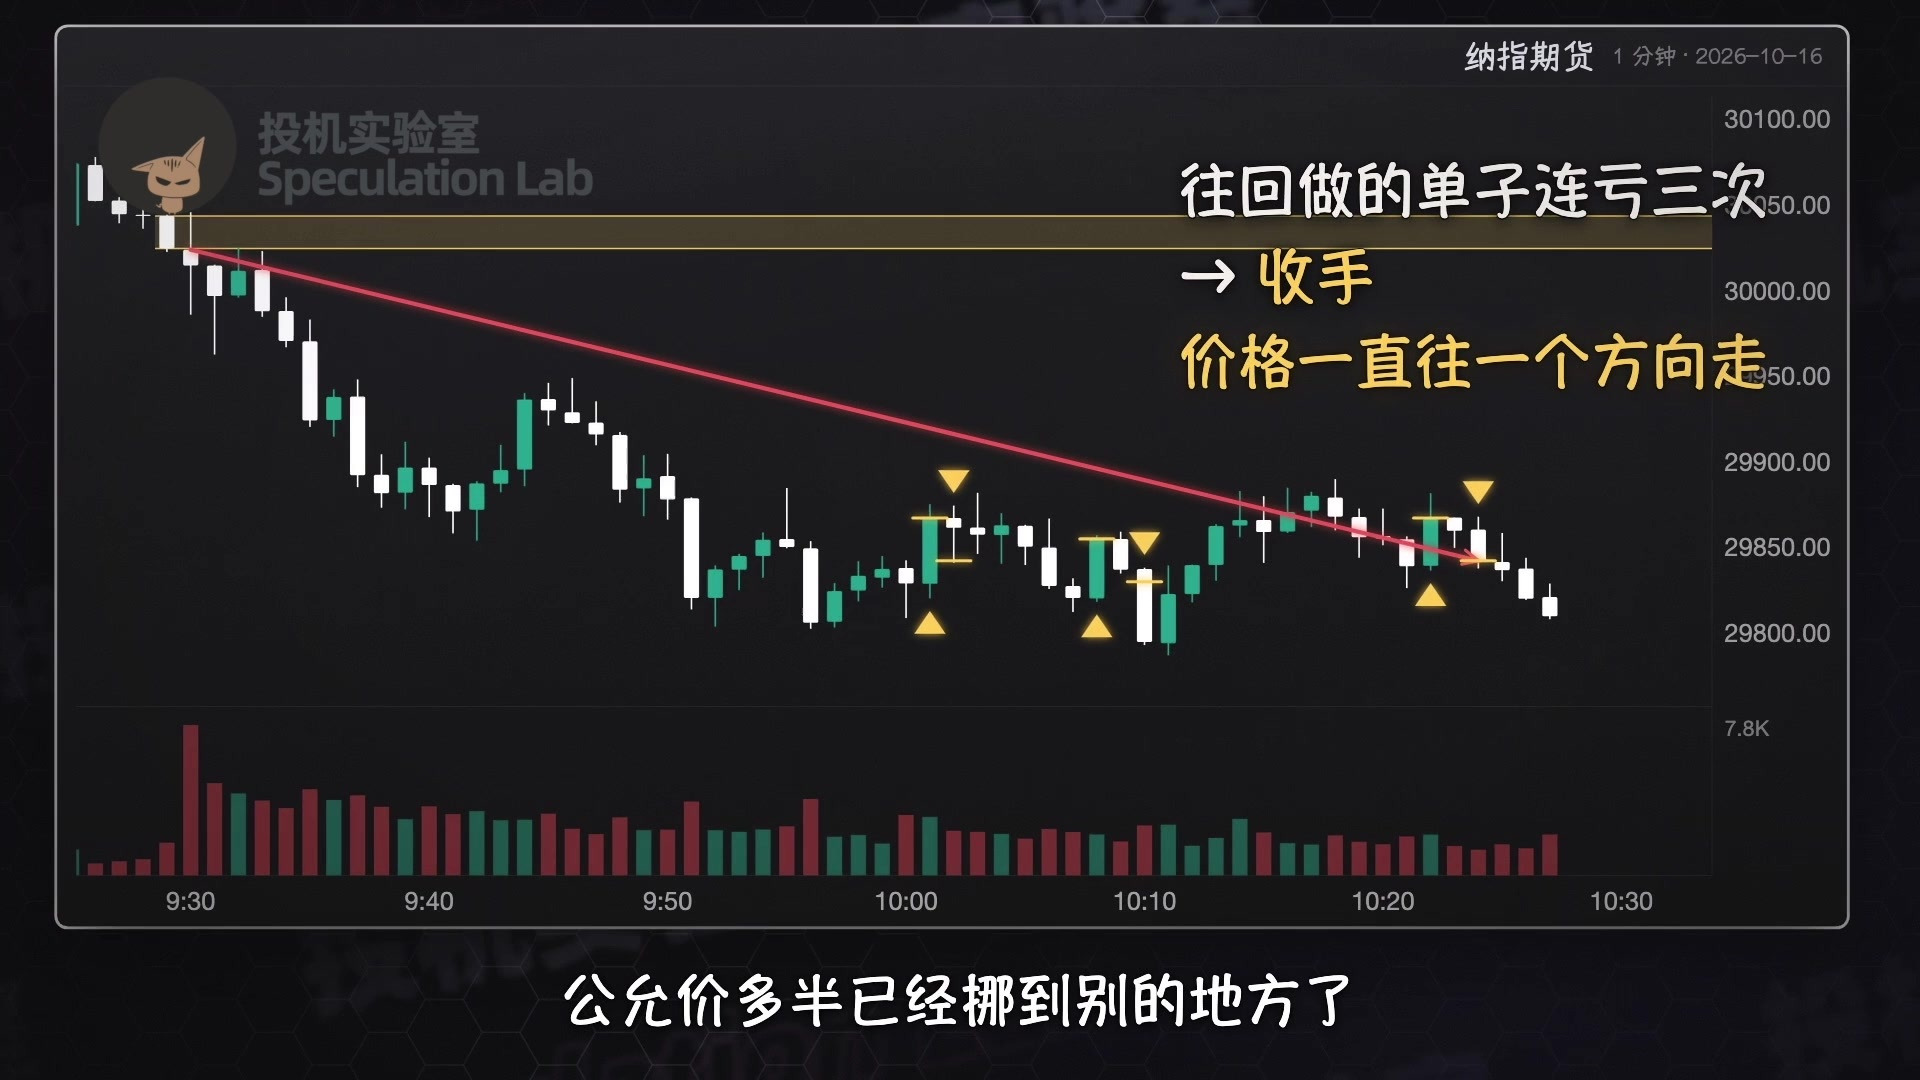
If he loses three trades in a row while trading back toward fair value in the same session, he stops. Three consecutive losses mean the price has been moving in one direction, and fair value has probably shifted somewhere else. In the next session, he treats the price where the market last settled as the new fair value.
If he’s in a trade when a new session opens, he first moves his stop to the entry price, so the worst-case outcome is breaking even. He also avoids holding a trade through data releases or speeches at 9:45 or 10:00.
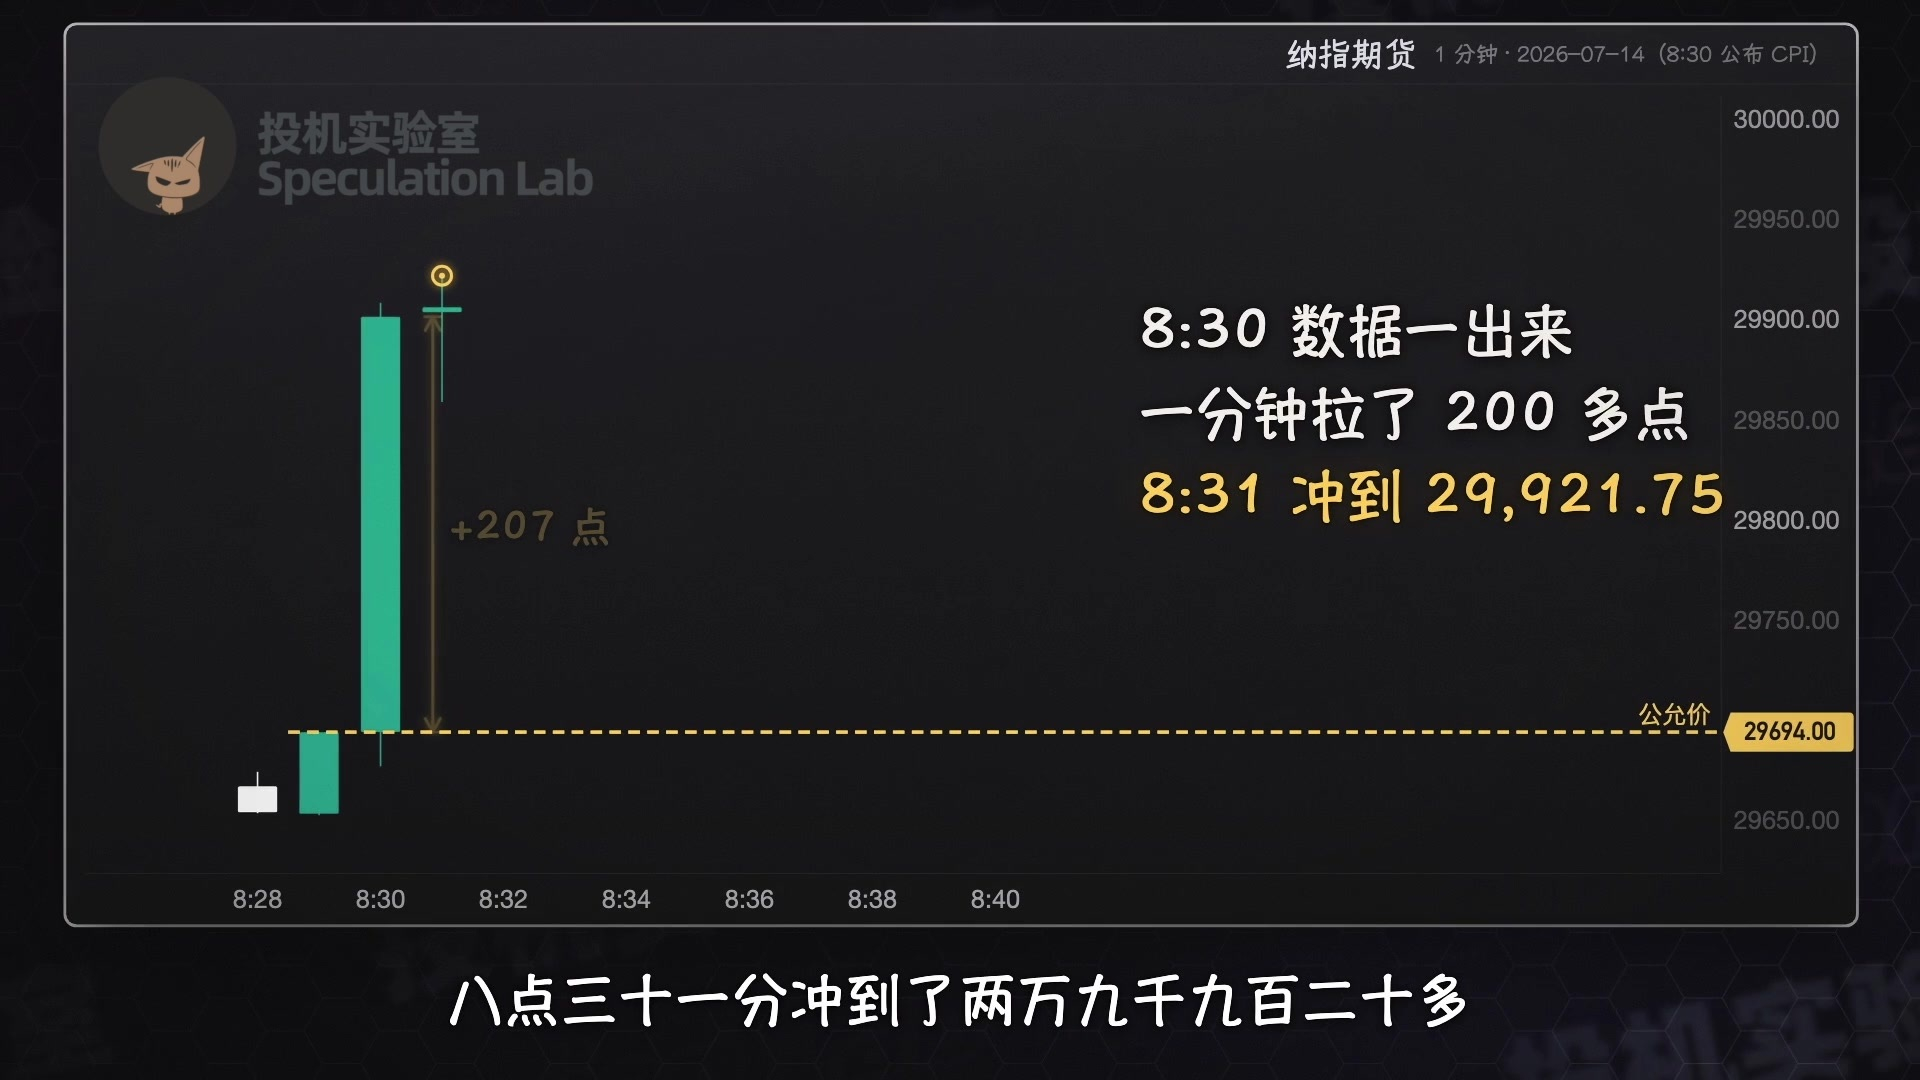
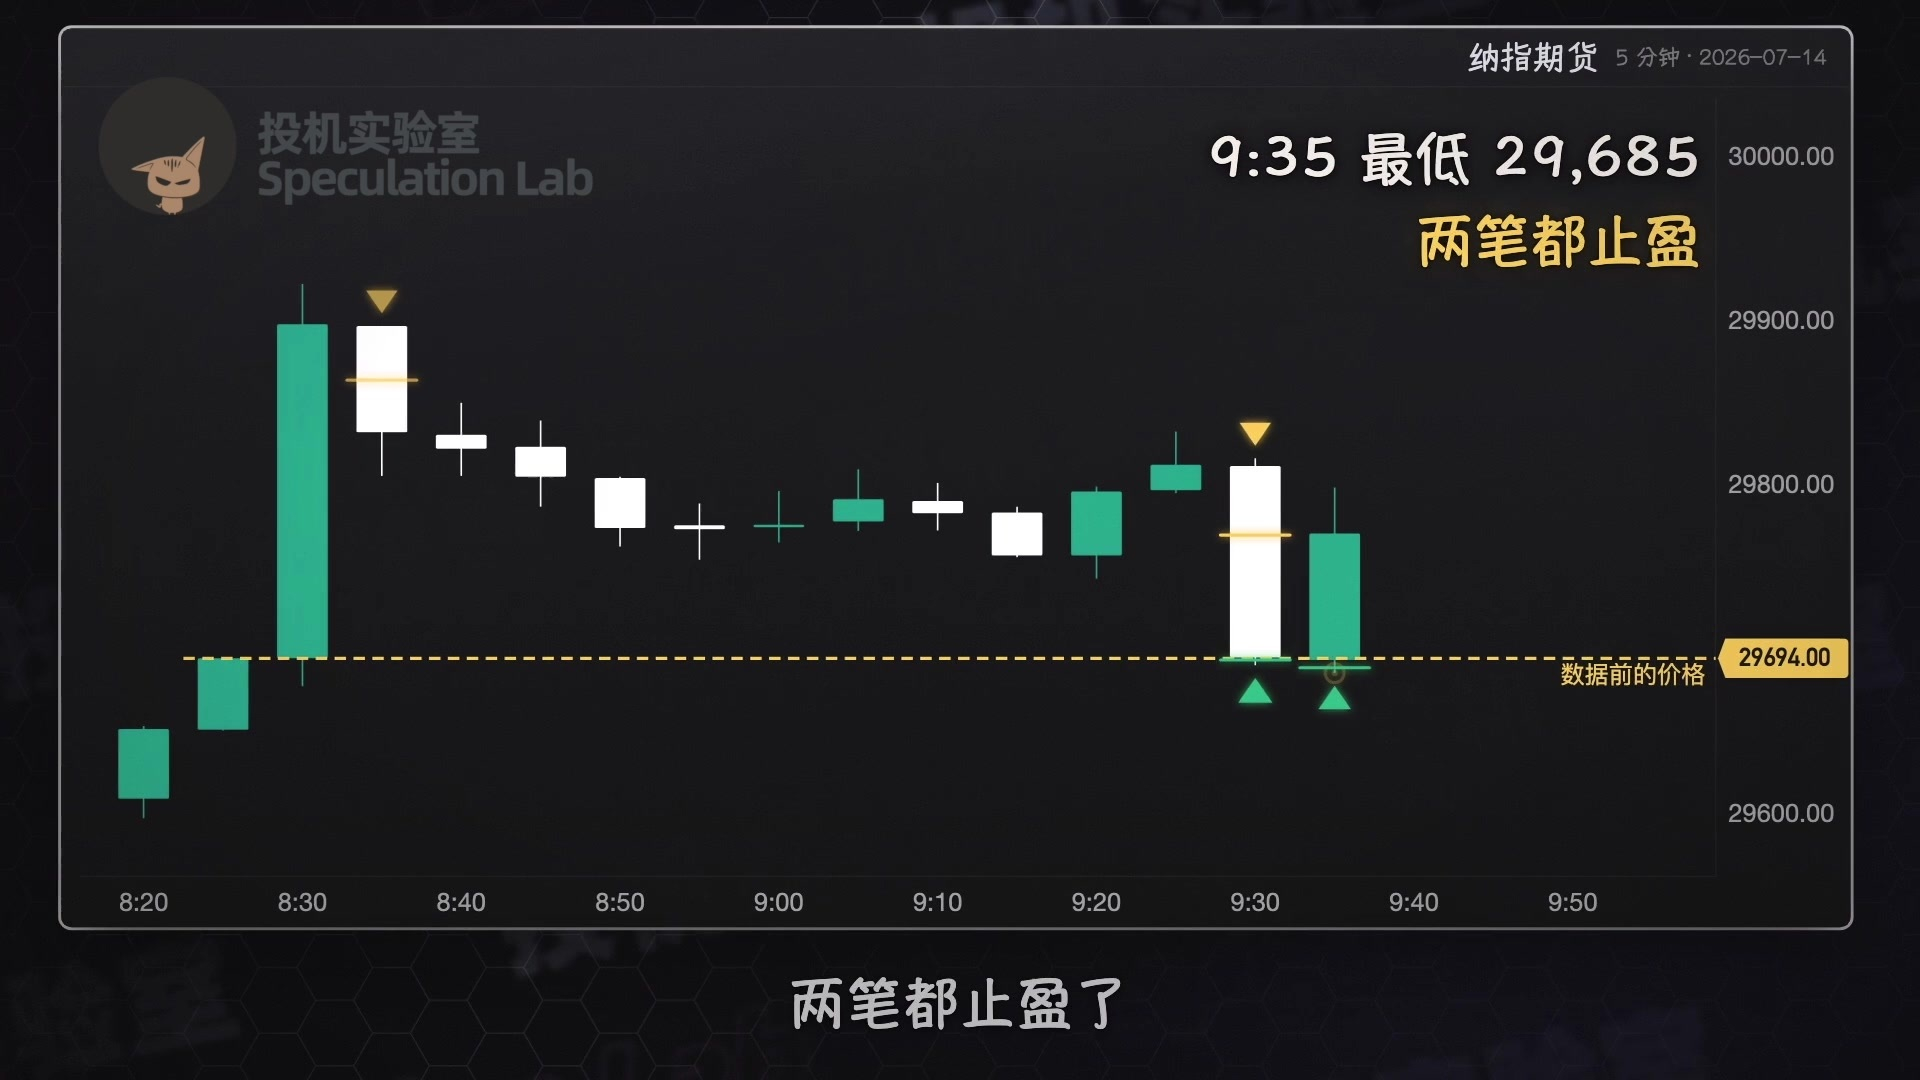
Here’s an example: On July 14, 2026, the U.S. released CPI data. The 8:29 candlestick closed at 29,694. That was the price before the data release, and therefore the fair value for the day.
When the 8:30 data came out, the price jumped more than 200 points in one minute, reaching over 29,920 at 8:31.
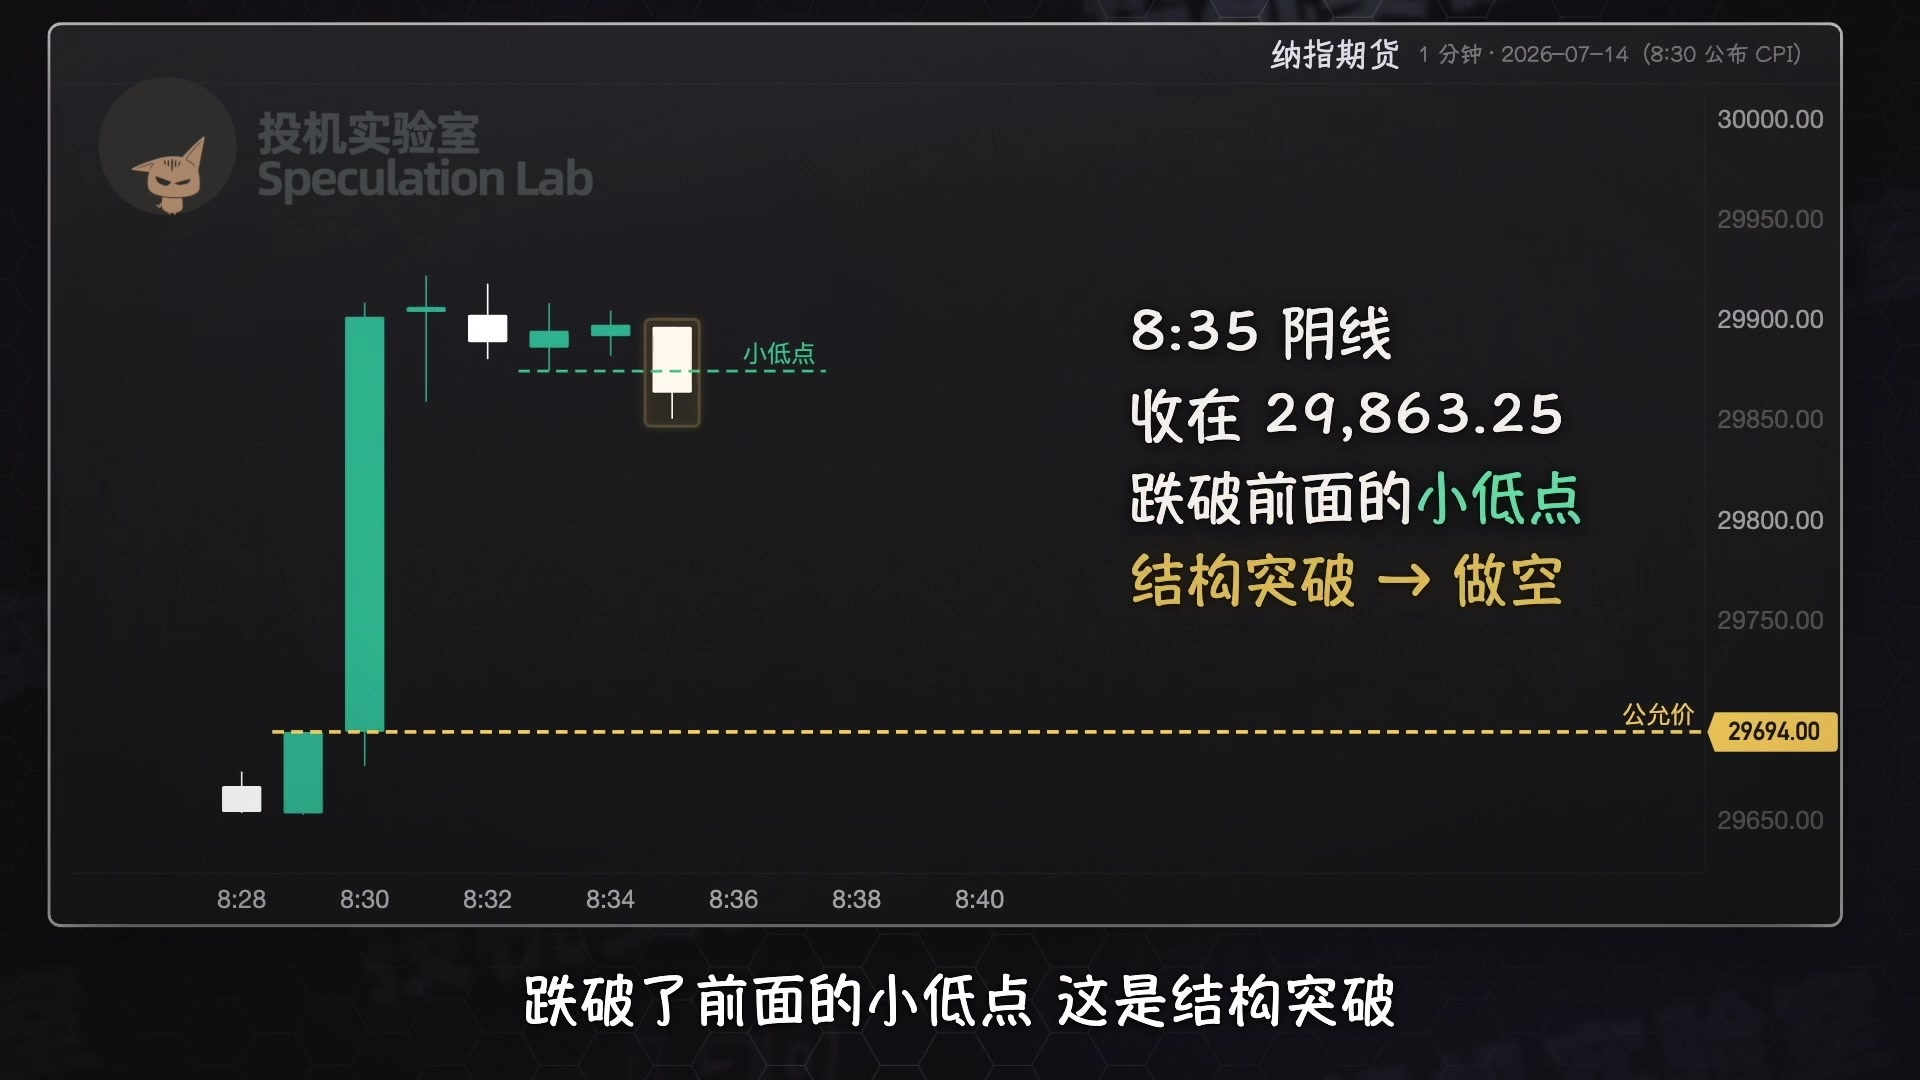
The price was more than 200 points above fair value, so that day he only looked for shorting opportunities. A bearish candle that came later was longer than the previous candle, but it didn’t close below the previous candle’s low. So it didn’t count as a displacement candle, and he didn’t trade.
At 8:35, a bearish candle closed at 29,863, breaking below the previous minor low. That was a structure break, so he could go short.
At that point, the price was still 169 points away from fair value. He set his take-profit at 175 points, which put it near fair value, and his stop-loss at 25 points.
At the 9:30 open, the first candlestick was bearish, moving more than 40 points from open to close. The trend was down, and a move back toward fair value was also down. He said this was the strongest kind of trade.
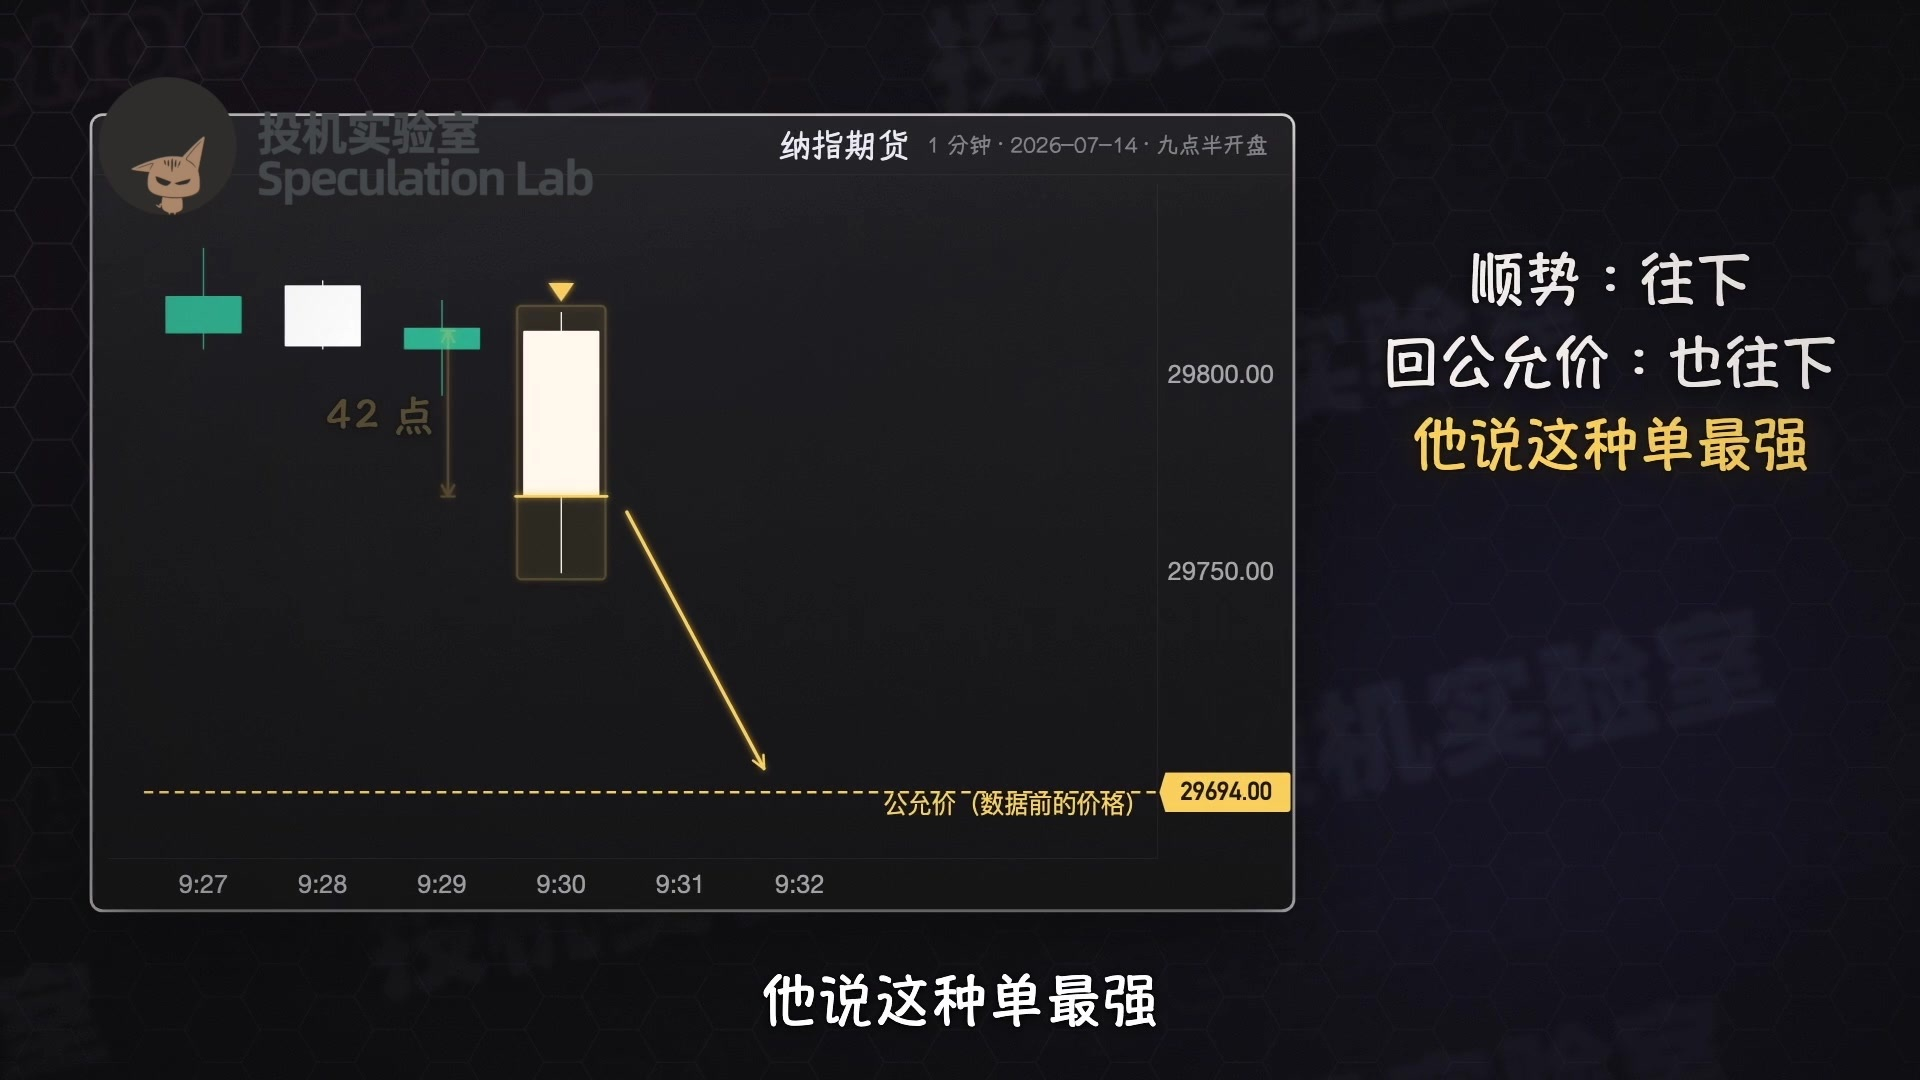
This candle was longer than 25 points, so by his rules he traded half his usual position size, with a 50-point stop and a 76-point take-profit. The price didn’t stop at the opening price at all—it plunged back to the pre-data price in five minutes. At 9:35, it hit a low of 29,685, and both trades hit their take-profit.
He said that in this situation, there’s no need to pay attention to the opening price. From then on, you just trade toward the price from before the data release.
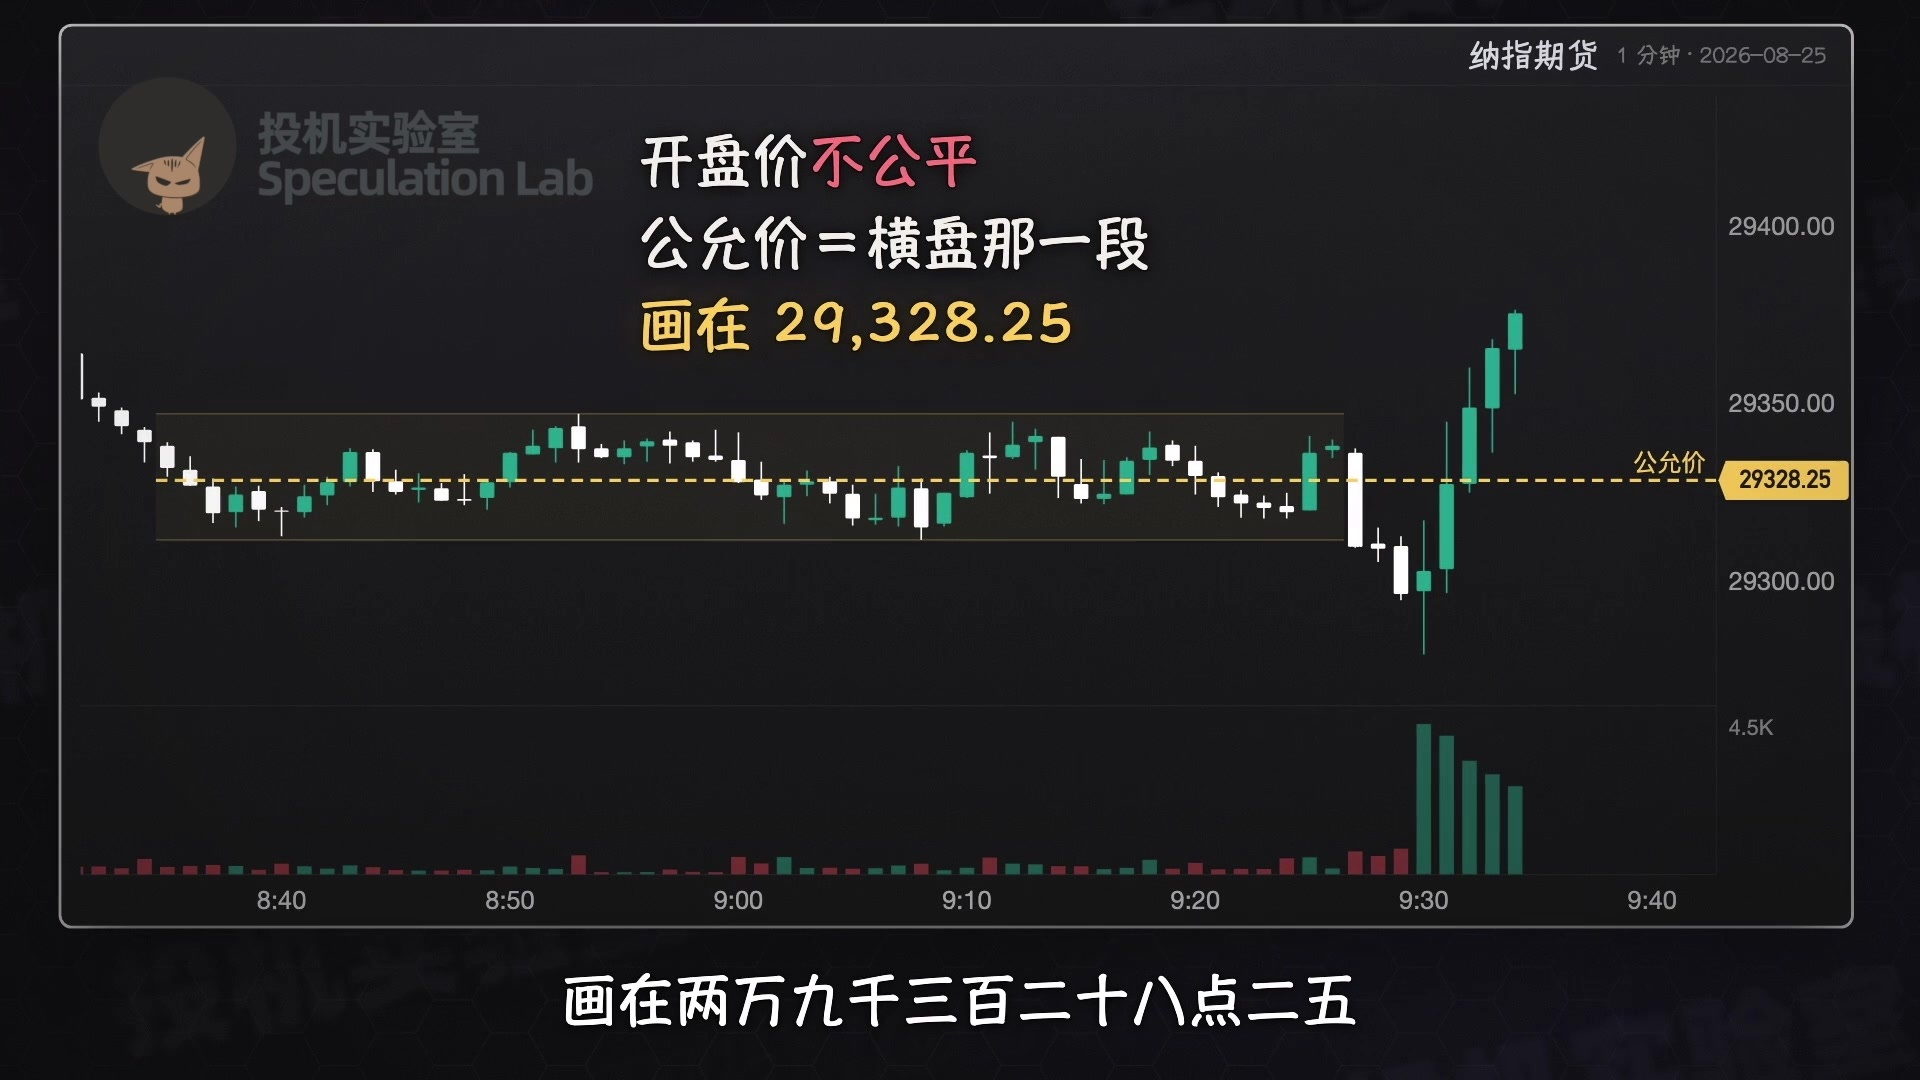
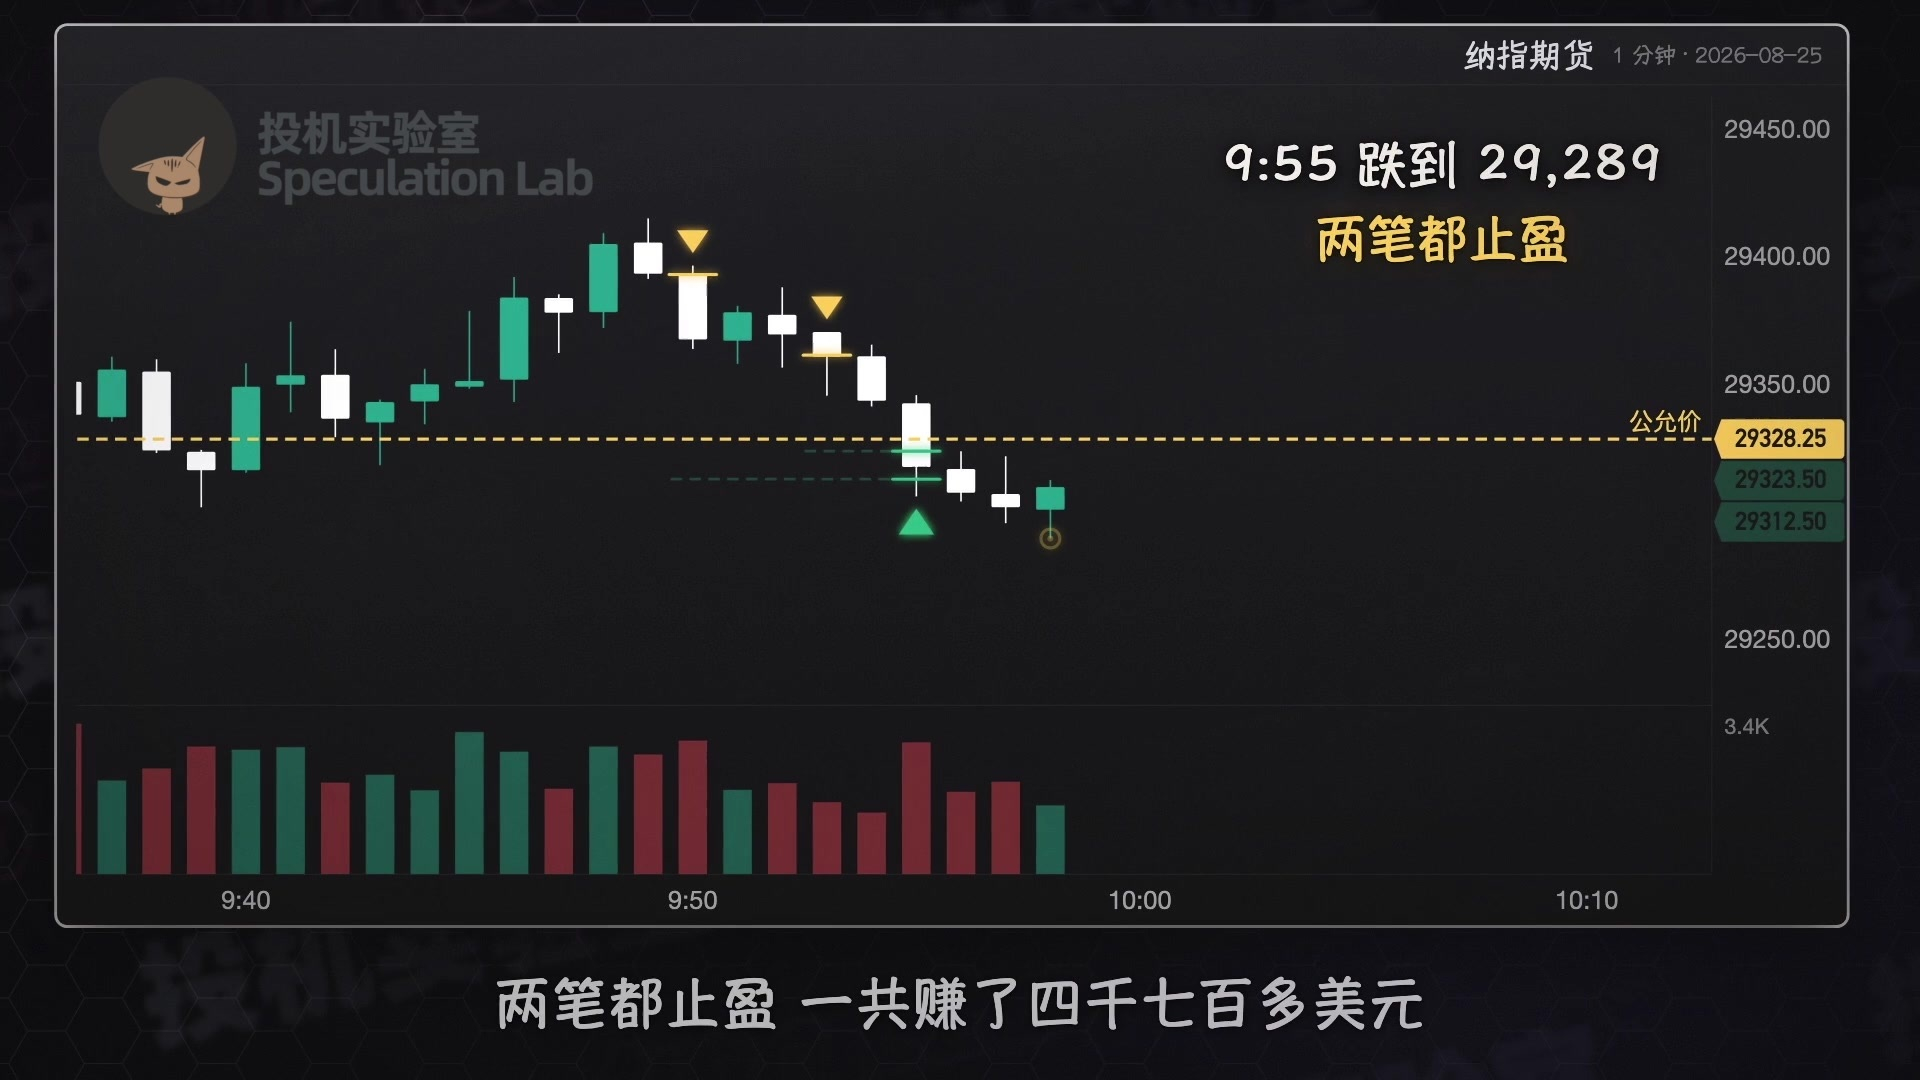
Here’s another example. On August 25, during the hour before the open, the price mostly moved sideways between 29,310 and just over 29,340. At 9:30, it opened at 29,297, but immediately surged back into that pre-open range and moved above it.
He judged that day’s opening price to be unfair. The fair value was the range where the price had moved sideways for an hour before the open, marked at 29,328.25.
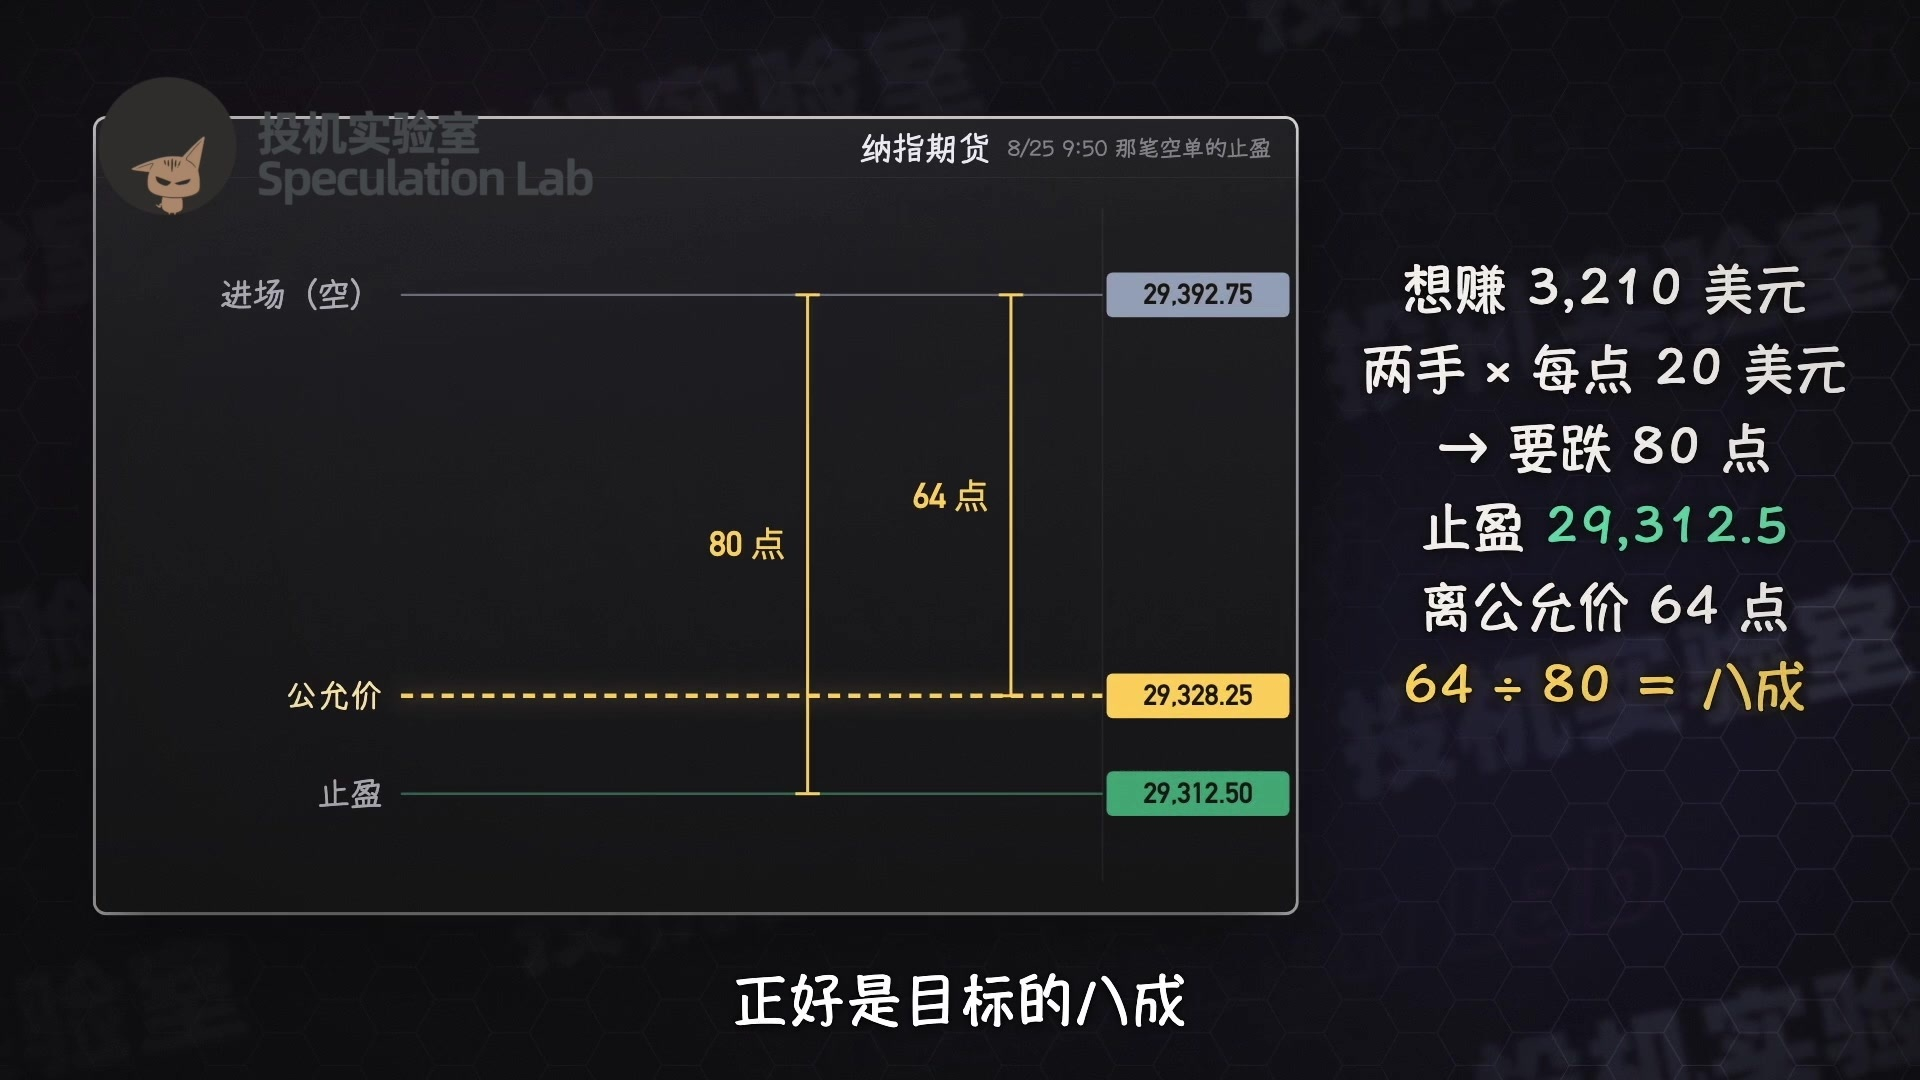
After 9:45, the price surged to just over 29,410, then was pushed back down, leaving a long upper wick. He didn’t wait for a standard signal and went short two contracts at 9:50, entering at 29,392.75 with a 62-point stop.
He wanted to make $3,210 on this trade. With two contracts, that meant the price had to fall 80 points, so he set his take-profit at 29,312.5. The price was 64 points from fair value, exactly 80% of the target distance.
Three minutes later, he went short two more contracts in another account. At 9:55, the price fell to 29,289. Both trades hit their take-profit, earning him more than $4,700 in total.
Later, the price fell too far, and he went long twice, trying to trade back toward fair value. Both trades hit their stop-loss. Before entering the second trade, he said, “If this one loses too, it means the structure has broken down, and the price will keep falling. I can’t trade it anymore.”
His fixed-point take-profit and stop-loss levels are based on the rules of proprietary trading firm accounts. For example, on a $50,000 evaluation account, making $3,000 is a pass, while losing $2,000 is a fail—a ratio of exactly 1 to 1.5.
He also says that if he were trading his own money, he would only trade back toward fair value, enter only on structure breaks, and focus mainly on reversions after data releases. Those are the trades he feels most confident about. He’d also set his take-profit and stop-loss based on the chart, rather than using fixed point values.

However, some people online aren’t convinced by this method. One person backtested multiple trades based on displacement candles and found no significant edge. Another claimed to be one of his students and said that following the method, two losing trades would blow an account, and that many people in the group had lost money.
He also said in March that this method only works on proprietary trading accounts. If you trade with your own money, you can probably only break even.
All right, this entertainment program is not investment advice. Check whether you’ve clicked the subscribe button. Good morning, good afternoon, good night, and goodbye.