$BNB
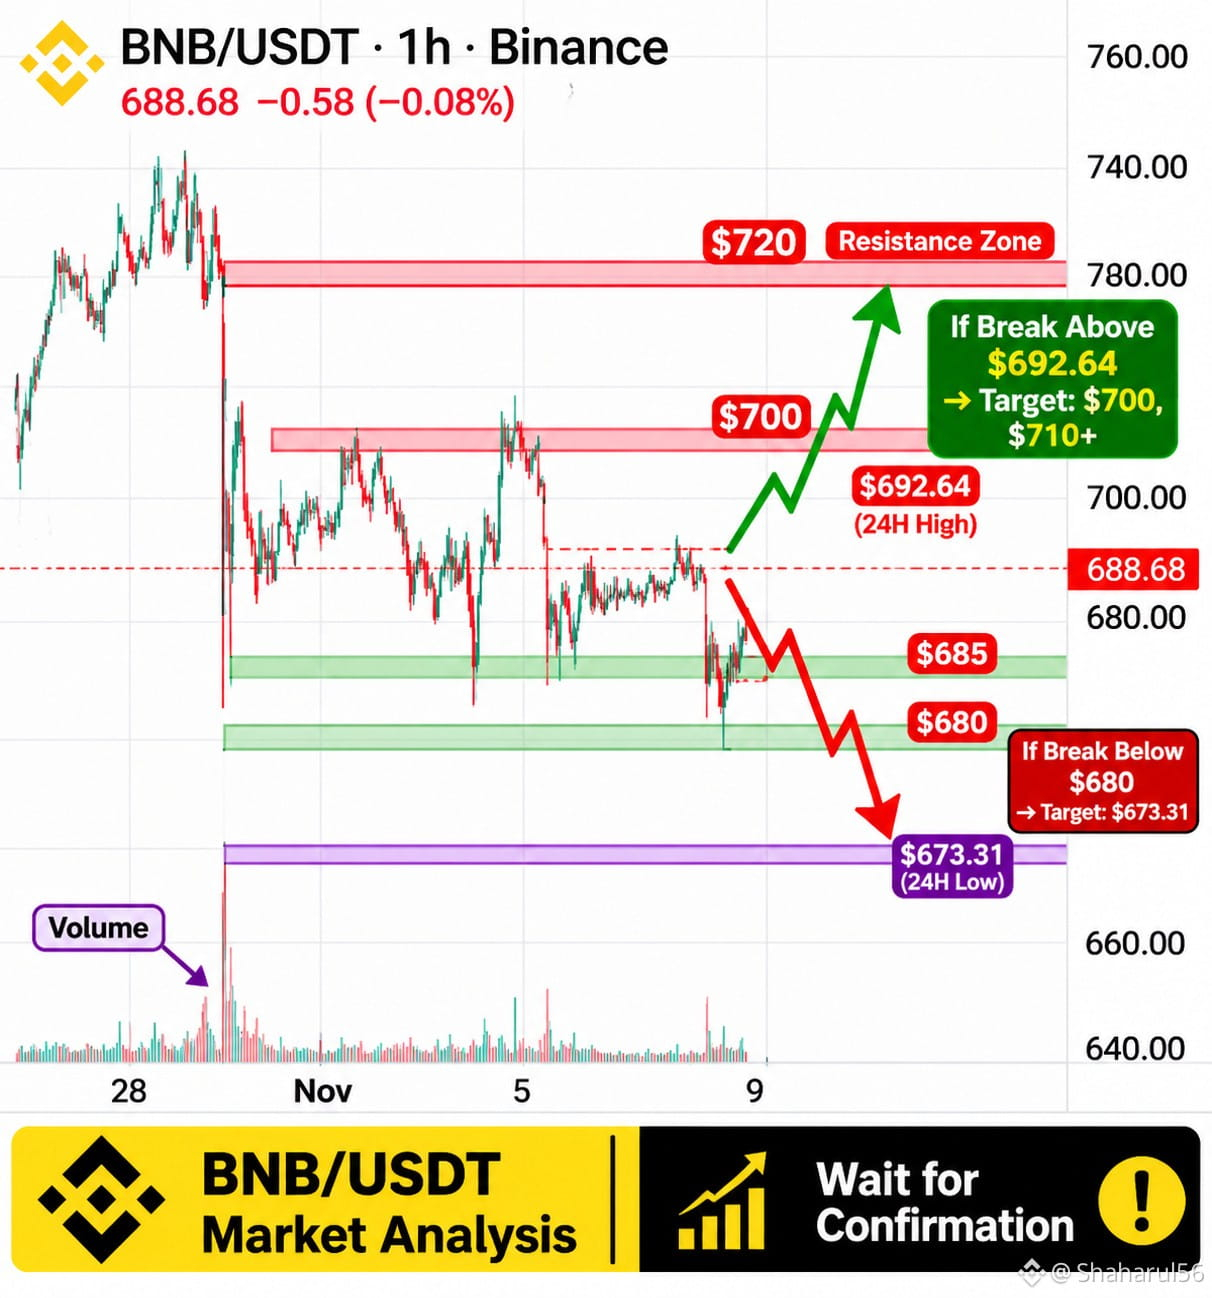
📊 BNB/USDT Market Analysis | 1H Timeframe
💰 Current Price: $688.68
BNB is showing signs of a broader bearish structure, followed by short-term consolidation around the $680–$700 zone.
🔎 Technical Analysis
1️⃣ Market Structure
- Overall trend: Bearish
- Recent price action: Sideways consolidation
- Buyers are attempting to recover from the $680 area.
2️⃣ Key Support Levels
- $685 – Immediate support
- $680 – Important support
- $673.31 – 24H Low / Major downside reference
3️⃣ Key Resistance Levels
- $692.64 – 24H High
- $700 – Psychological resistance
- $710–$720 – Higher resistance zone
📈 Bullish Scenario (BUY Confirmation)
If BNB breaks above $692.64 and a 1H candle closes above this level with strong volume, a move toward $700 and potentially $710 could become possible.
📉 Bearish Scenario (SELL Confirmation)
If BNB fails to break resistance and loses the $680 support with strong selling volume, the next downside reference could be $673.31.
⚠️ Important Trading Conditions
- Wait for candle-close confirmation.
- Check volume before considering a breakout.
- Avoid entering during uncertain price action.
- Always define risk before making any trading decision.
🎯 My Market Outlook:
BNB is currently at a critical decision zone. A confirmed breakout above resistance may favor buyers, while a confirmed breakdown below support may favor sellers.
Don't predict the market. Wait for confirmation.
What do you think? Will BNB break above $700 or revisit $673?
#bnb #BNBUSDT #TechnicalAnalysis #PriceAction #CryptoMarket
📊 BNB/USDT Market Analysis | 1H Timeframe
💰 Current Price: $688.68
BNB is showing signs of a broader bearish structure, followed by short-term consolidation around the $680–$700 zone.
🔎 Technical Analysis
1️⃣ Market Structure
- Overall trend: Bearish
- Recent price action: Sideways consolidation
- Buyers are attempting to recover from the $680 area.
2️⃣ Key Support Levels
- $685 – Immediate support
- $680 – Important support
- $673.31 – 24H Low / Major downside reference
3️⃣ Key Resistance Levels
- $692.64 – 24H High
- $700 – Psychological resistance
- $710–$720 – Higher resistance zone
📈 Bullish Scenario (BUY Confirmation)
If BNB breaks above $692.64 and a 1H candle closes above this level with strong volume, a move toward $700 and potentially $710 could become possible.
📉 Bearish Scenario (SELL Confirmation)
If BNB fails to break resistance and loses the $680 support with strong selling volume, the next downside reference could be $673.31.
⚠️ Important Trading Conditions
- Wait for candle-close confirmation.
- Check volume before considering a breakout.
- Avoid entering during uncertain price action.
- Always define risk before making any trading decision.
🎯 My Market Outlook:
BNB is currently at a critical decision zone. A confirmed breakout above resistance may favor buyers, while a confirmed breakdown below support may favor sellers.
Don't predict the market. Wait for confirmation.
What do you think? Will BNB break above $700 or revisit $673?
#bnb #BNBUSDT #TechnicalAnalysis #PriceAction #CryptoMarket