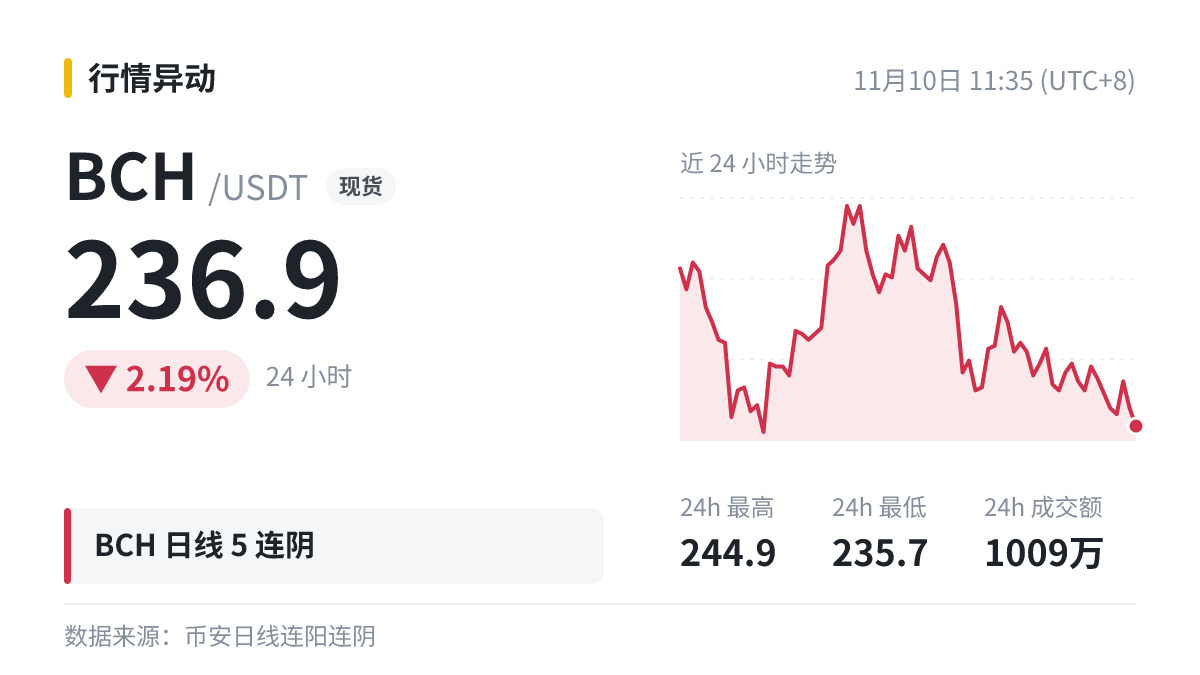
Indicator note | $BCH | 5 consecutive bearish daily candles | cumulative -15.25%
Definition: Consecutive bullish daily candles differ from consecutive candles on the 4-hour chart: each daily candle represents a full day of buying and selling, so several candles of the same color in a row are rarer on the daily chart.
As for how to read this: after consecutive candles move in the same direction, the price has often already moved some distance away from its short-term moving average. A pullback toward the moving average is not unusual.
The same data can mean very different things in different market conditions, so don’t apply any one rule mechanically.
Definition: Consecutive bullish daily candles differ from consecutive candles on the 4-hour chart: each daily candle represents a full day of buying and selling, so several candles of the same color in a row are rarer on the daily chart.
As for how to read this: after consecutive candles move in the same direction, the price has often already moved some distance away from its short-term moving average. A pullback toward the moving average is not unusual.
The same data can mean very different things in different market conditions, so don’t apply any one rule mechanically.