#指标解读 $ETH The indicators are basically all pointing in the same direction this time.
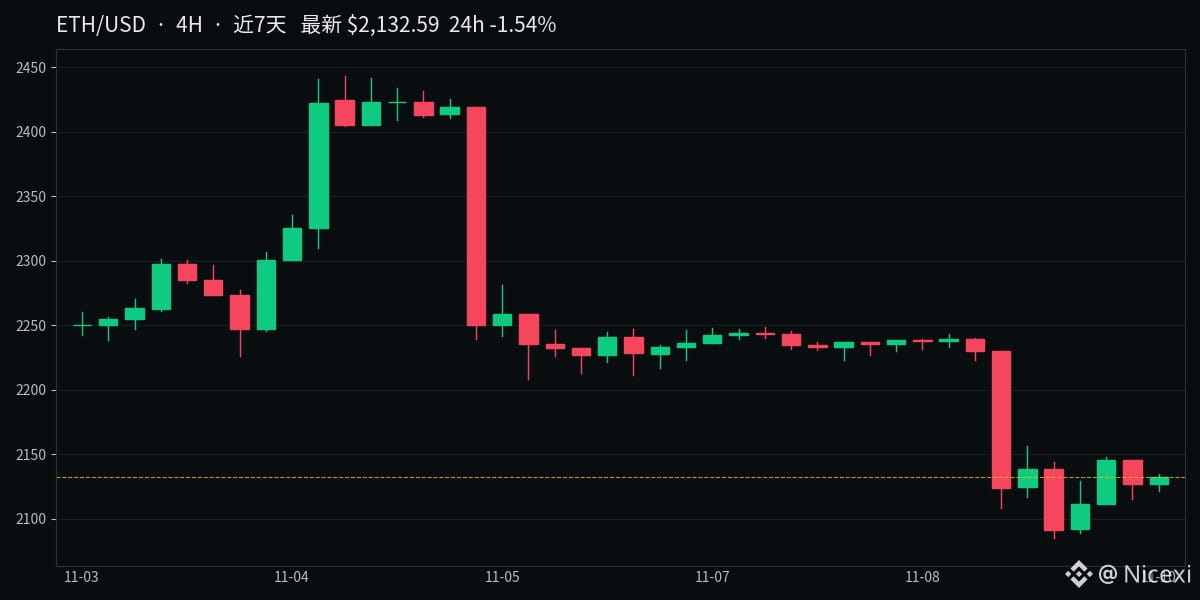
The current price is around 2120, down 1.5% over 24 hours. On the 4-hour chart, the price is still capped below MA25 (2205), and it hasn't reclaimed the Bollinger middle band at 2198 either. The short-term structure is simply weak.
RSI(14) has dropped to 31, just a step away from the oversold threshold of 30. MACD is still below the zero line, with the histogram at -7.5; bearish momentum shows no sign of easing yet.
However, the price is already near the lower Bollinger band around 2088, and the 7-day low of 2085 is also close by. Volume is 10% above the 7-day average, so it's worth watching to see whether selling pressure is running out at this level.
Two possible scenarios: if the price holds firmly in the 2085–2088 range, the oversold rebound could first target 2198–2205. If it decisively breaks below that range, there isn't much meaningful support further down.
The current price is around 2120, down 1.5% over 24 hours. On the 4-hour chart, the price is still capped below MA25 (2205), and it hasn't reclaimed the Bollinger middle band at 2198 either. The short-term structure is simply weak.
RSI(14) has dropped to 31, just a step away from the oversold threshold of 30. MACD is still below the zero line, with the histogram at -7.5; bearish momentum shows no sign of easing yet.
However, the price is already near the lower Bollinger band around 2088, and the 7-day low of 2085 is also close by. Volume is 10% above the 7-day average, so it's worth watching to see whether selling pressure is running out at this level.
Two possible scenarios: if the price holds firmly in the 2085–2088 range, the oversold rebound could first target 2198–2205. If it decisively breaks below that range, there isn't much meaningful support further down.