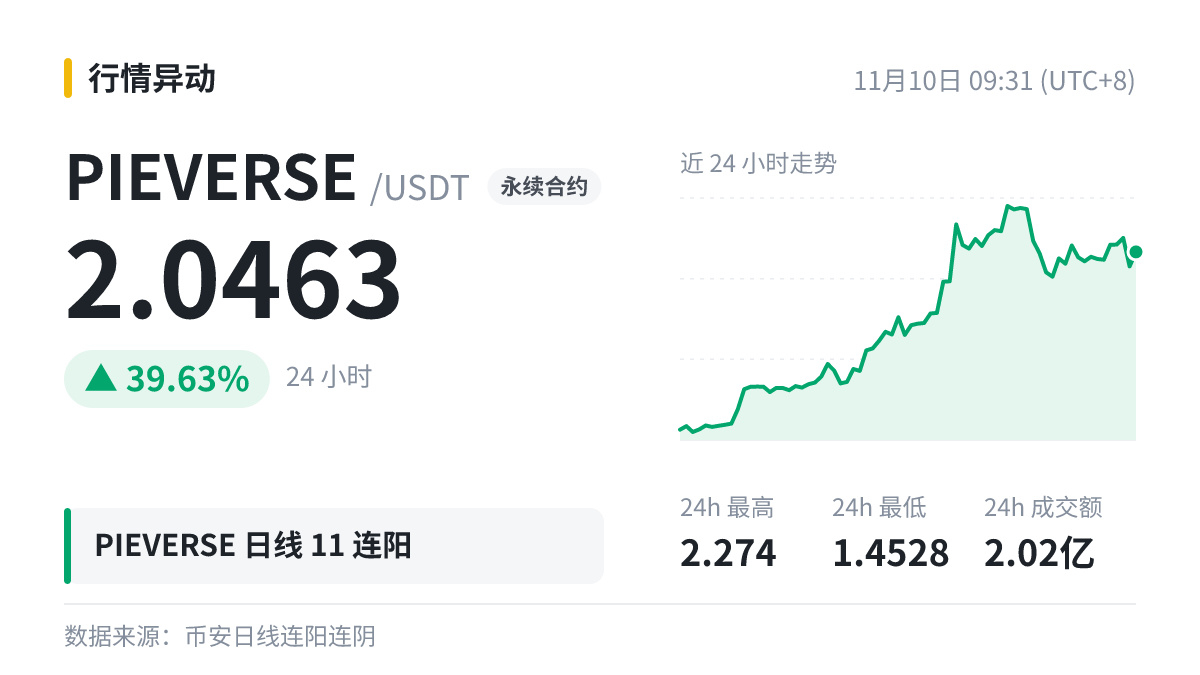
$PIEVERSE daily chart: 11 consecutive bullish candles, up +106.47% in total during that period, and +1.39% so far today.
A beginner’s burning question: How do you interpret 11 consecutive bullish daily candles?
Before today’s daily candlestick closes, its color can change at any time: if the price moves to the other side of the opening price during the session, the bullish candle may turn bearish.
Eleven consecutive bullish days—that’s longer than I’ve managed to stick to getting up early.
Cross-checking multiple indicators is more reliable than looking at just one, but even more signals can’t provide a definitive answer.
A beginner’s burning question: How do you interpret 11 consecutive bullish daily candles?
Before today’s daily candlestick closes, its color can change at any time: if the price moves to the other side of the opening price during the session, the bullish candle may turn bearish.
Eleven consecutive bullish days—that’s longer than I’ve managed to stick to getting up early.
Cross-checking multiple indicators is more reliable than looking at just one, but even more signals can’t provide a definitive answer.