🔥 $ZEC Technical Update: Key Levels & Momentum Breakdown
📊 1. Market Snapshot
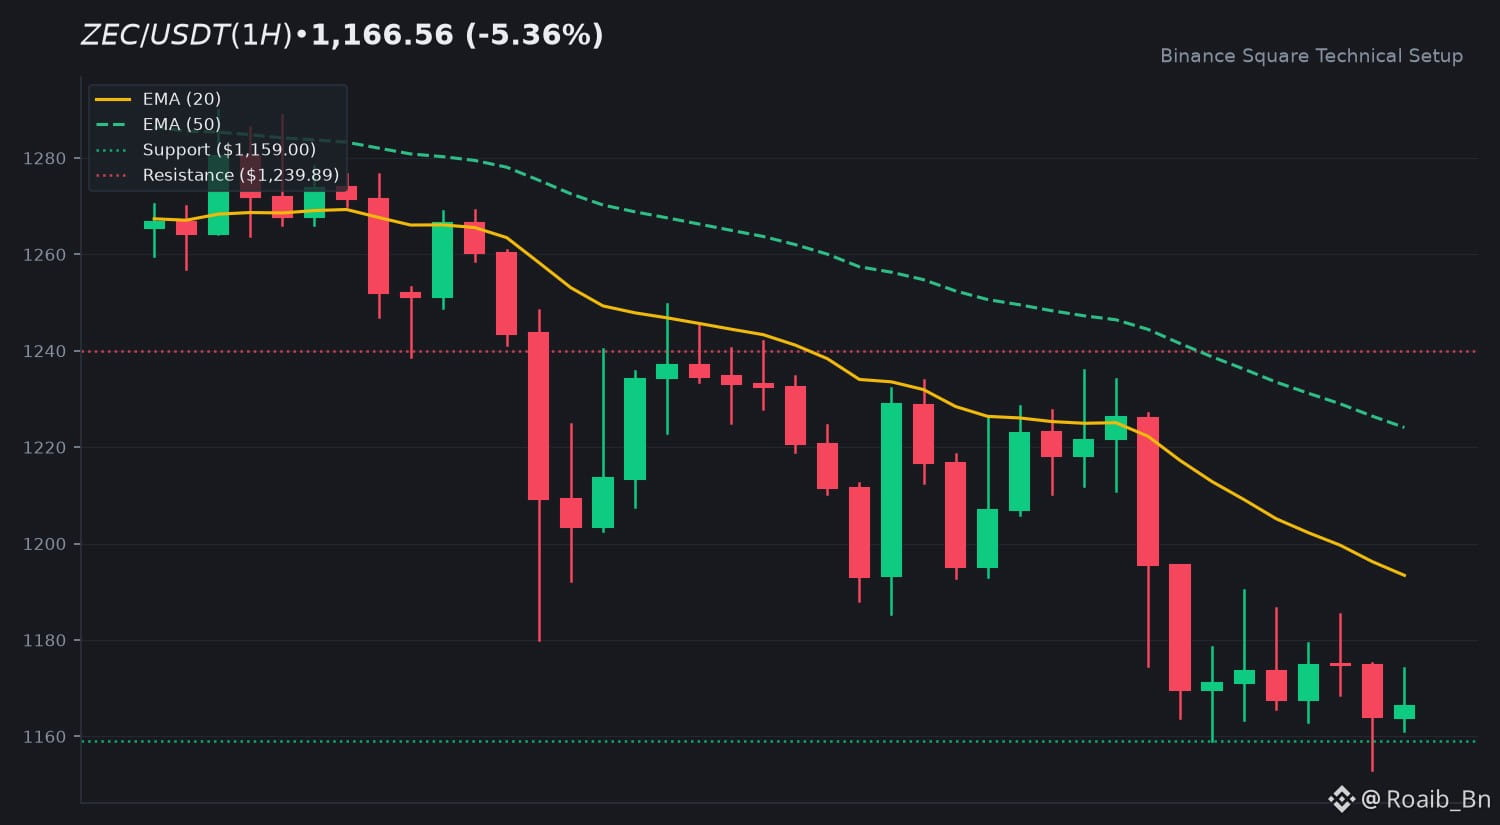
The current market price for $ZEC is 1,166.56 USDT, reflecting a 24h change of -5.36%. Trading activity remains quiet with a 24h volume of 196,738,011 USDT. The volume-to-20-SMA ratio of 0.27x indicates weak conviction and current consolidation patterns within the broader structure.
📈 2. Technical Momentum & Indicator Bias
$ZEC is exhibiting a clear downtrend posture as price action remains below the EMA 20 at 1,193.40 and the EMA 50 at 1,224.07. The RSI at 35.82 suggests the asset is approaching oversold territory but lacks immediate bullish divergence. The MACD histogram sits at -1.9889 with the MACD line positioned below the signal line, confirming a lack of upward momentum at this stage.
🎯 3. Key Technical Levels to Watch
• 🟢 Resistance Zone: Initial resistance is identified at 1,239.89, followed by a secondary ceiling near 1,278.95.
• 🔴 Support Zone: The immediate support floor is established at 1,159.00. A breach here could shift the outlook toward lower liquidity zones.
• 🛡️ Pivot Confluence: The 1,193.40 EMA 20 level serves as the primary pivot for any potential trend reversal attempts.
💡 4. Technical Takeaway & Risk Management
Price action is currently testing the lower bounds of recent ranges. Traders are monitoring whether the 1,159.00 support level can hold to prevent further downside extension. Without an increase in volume to reclaim the EMA 20, the bias remains cautious. Focus on how the asset interacts with these specific levels during the upcoming sessions.
💬 5. Community Discussion
What is your technical outlook for $ZEC this week? Are you accumulating or waiting for confirmation? Drop your thoughts below! 👇
⚠️ 6. Disclaimer
Educational technical analysis only. Not financial advice (NFA). Crypto markets involve risk. Always DYOR.
$ZEC #ZEC #BinanceSquare
📊 1. Market Snapshot
The current market price for $ZEC is 1,166.56 USDT, reflecting a 24h change of -5.36%. Trading activity remains quiet with a 24h volume of 196,738,011 USDT. The volume-to-20-SMA ratio of 0.27x indicates weak conviction and current consolidation patterns within the broader structure.
📈 2. Technical Momentum & Indicator Bias
$ZEC is exhibiting a clear downtrend posture as price action remains below the EMA 20 at 1,193.40 and the EMA 50 at 1,224.07. The RSI at 35.82 suggests the asset is approaching oversold territory but lacks immediate bullish divergence. The MACD histogram sits at -1.9889 with the MACD line positioned below the signal line, confirming a lack of upward momentum at this stage.
🎯 3. Key Technical Levels to Watch
• 🟢 Resistance Zone: Initial resistance is identified at 1,239.89, followed by a secondary ceiling near 1,278.95.
• 🔴 Support Zone: The immediate support floor is established at 1,159.00. A breach here could shift the outlook toward lower liquidity zones.
• 🛡️ Pivot Confluence: The 1,193.40 EMA 20 level serves as the primary pivot for any potential trend reversal attempts.
💡 4. Technical Takeaway & Risk Management
Price action is currently testing the lower bounds of recent ranges. Traders are monitoring whether the 1,159.00 support level can hold to prevent further downside extension. Without an increase in volume to reclaim the EMA 20, the bias remains cautious. Focus on how the asset interacts with these specific levels during the upcoming sessions.
💬 5. Community Discussion
What is your technical outlook for $ZEC this week? Are you accumulating or waiting for confirmation? Drop your thoughts below! 👇
⚠️ 6. Disclaimer
Educational technical analysis only. Not financial advice (NFA). Crypto markets involve risk. Always DYOR.
$ZEC #ZEC #BinanceSquare