MU Trend Analysis
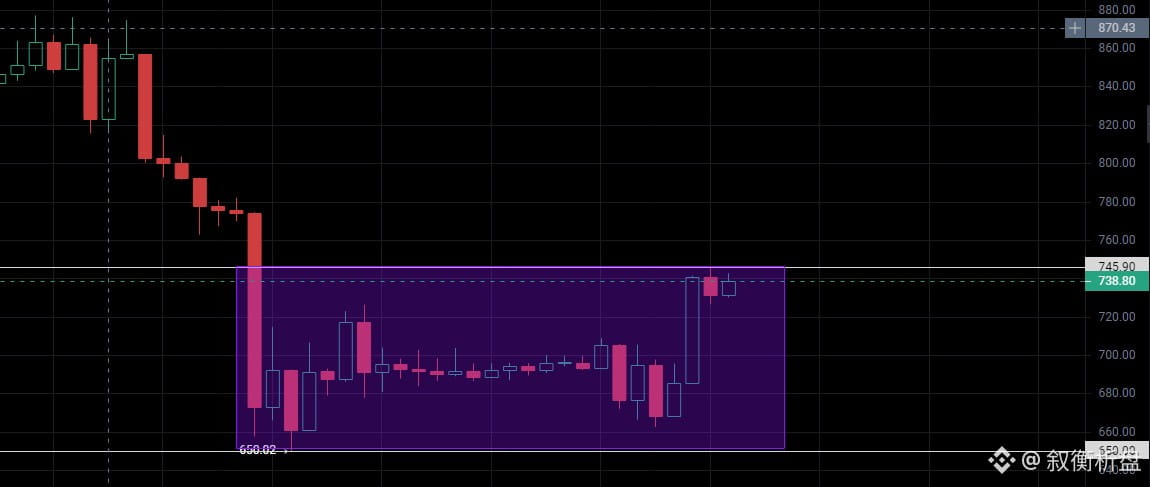
The broader downtrend in MU is now firmly established, and there are currently no signs of a reversal on the chart. Every rebound at this stage is merely a breather for the bears, offering an opportunity to establish short positions at higher levels.
The candlestick chart clearly shows that whenever the market begins to show signs of a rebound, selling pressure quickly pushes it back down into the range. This is the main players shaking out the market through volatility. Repeated swings are clearing out weak hands and steadily building bearish momentum; a major downward move could begin at any time.
Stay with the trend when trading, and do not be misled by brief rebounds into blindly buying the dip. Wait for signs that a rebound is meeting resistance before looking for an entry. Keep position sizes under strict control and manage risk carefully. Set a stop loss at 760.
Trade suggestion: Short on a rebound to 745–750; targets: 710–680
$MU
The broader downtrend in MU is now firmly established, and there are currently no signs of a reversal on the chart. Every rebound at this stage is merely a breather for the bears, offering an opportunity to establish short positions at higher levels.
The candlestick chart clearly shows that whenever the market begins to show signs of a rebound, selling pressure quickly pushes it back down into the range. This is the main players shaking out the market through volatility. Repeated swings are clearing out weak hands and steadily building bearish momentum; a major downward move could begin at any time.
Stay with the trend when trading, and do not be misled by brief rebounds into blindly buying the dip. Wait for signs that a rebound is meeting resistance before looking for an entry. Keep position sizes under strict control and manage risk carefully. Set a stop loss at 760.
Trade suggestion: Short on a rebound to 745–750; targets: 710–680
$MU