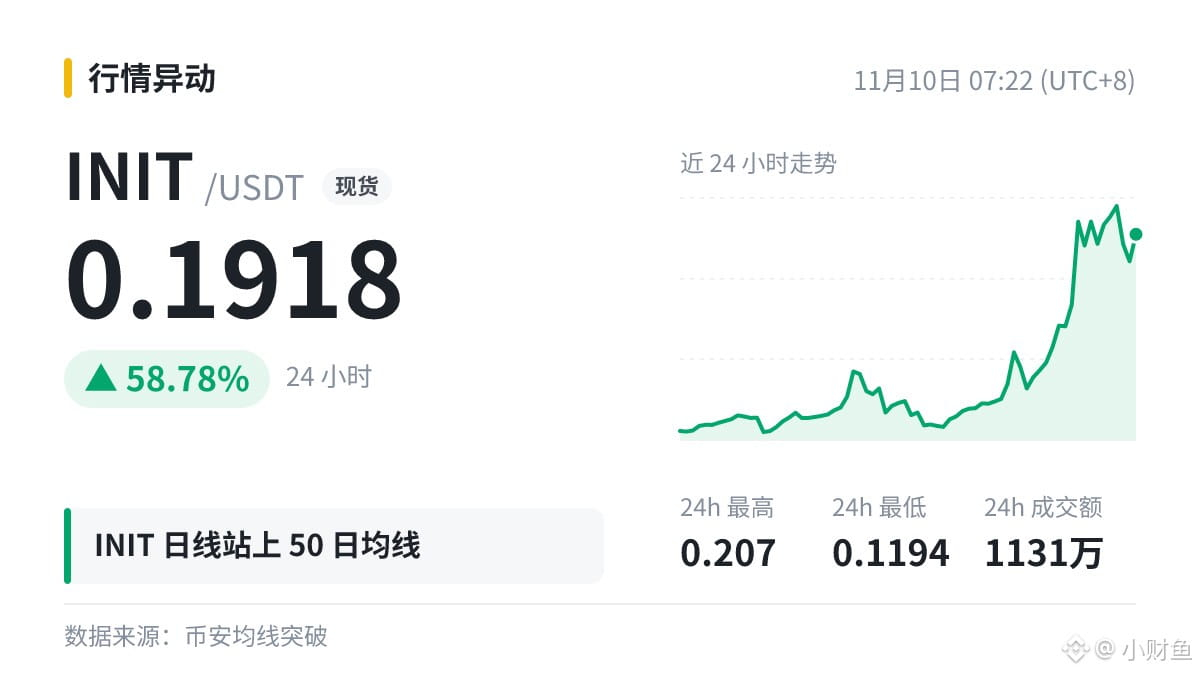
$INIT The daily chart has moved above MA50 (0.1293).
Let’s talk about what lies behind this number.
Moving averages are also often seen as dynamic support and resistance: when the price is above a moving average and pulls back toward it, many people watch to see whether it can hold.
Whether trading volume increases when the price moves above or below a moving average is also often used as a clue: a move on low volume is more likely to be just a brief test.
Understanding this indicator is about not being spooked by a single number, not using it to predict tops and bottoms.
Take it as food for thought; don’t follow it blindly. Make your own decisions.
Let’s talk about what lies behind this number.
Moving averages are also often seen as dynamic support and resistance: when the price is above a moving average and pulls back toward it, many people watch to see whether it can hold.
Whether trading volume increases when the price moves above or below a moving average is also often used as a clue: a move on low volume is more likely to be just a brief test.
Understanding this indicator is about not being spooked by a single number, not using it to predict tops and bottoms.
Take it as food for thought; don’t follow it blindly. Make your own decisions.