⚡ Market Titans Dual Analysis: Bitcoin $BTC vs Ethereum $ETH
1. Bitcoin $BTC Technical Outlook
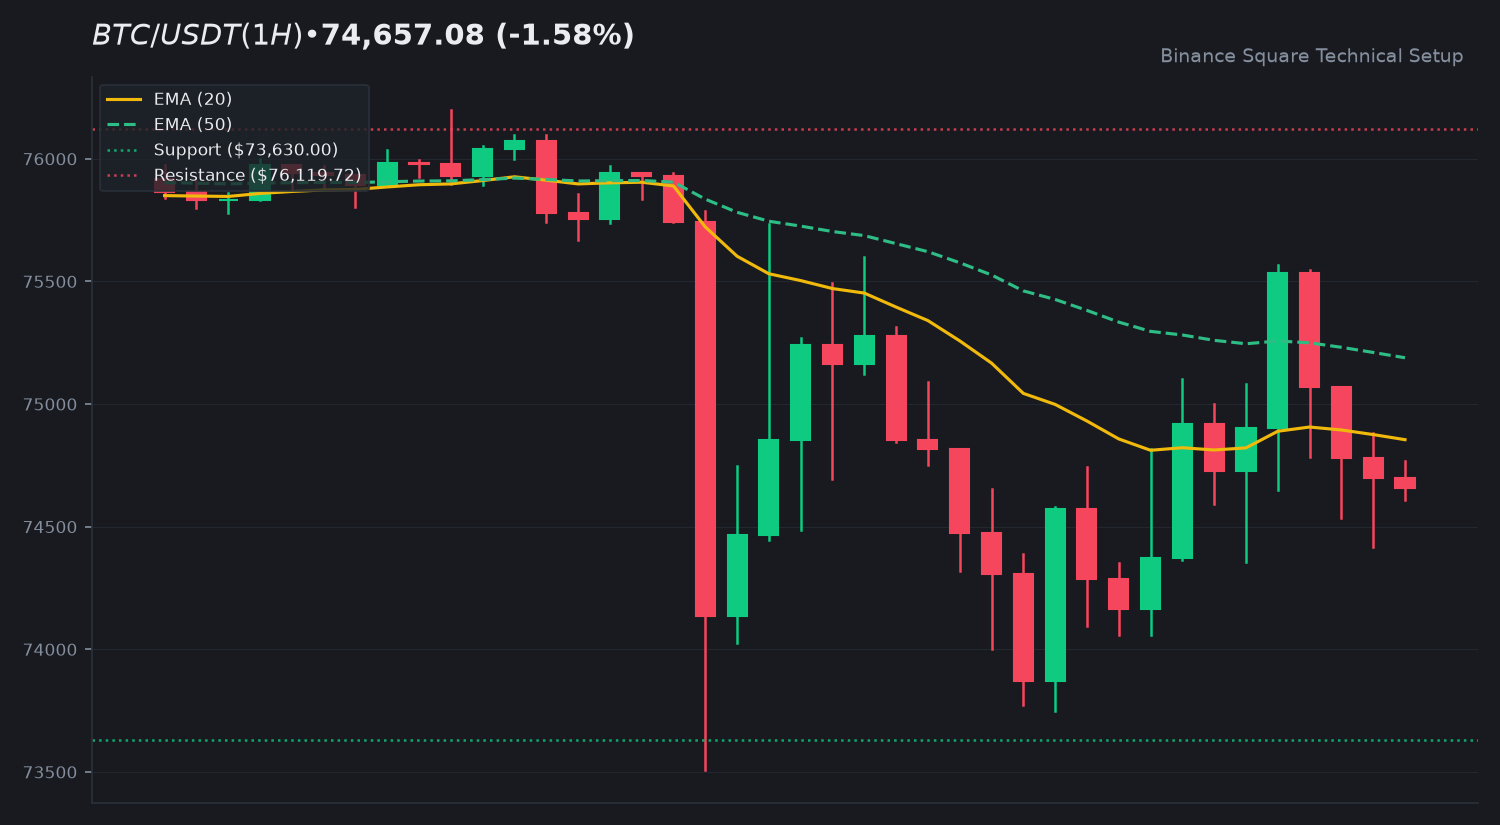
The asset is currently trading at 74,657.08, reflecting a slight contraction of 1.58%. Price action remains positioned below both the EMA 20 (74,854.82) and EMA 50 (75,188.74), indicating a prevailing short-term bearish bias. With an RSI of 45.93, the asset is neither overbought nor oversold, suggesting a neutral momentum state. Key technical levels to monitor include the support floor at 73,630.00 and the overhead resistance zone at 76,119.72.
2. Ethereum $ETH Technical Outlook
Ethereum $ETH shows a more pronounced decline of 4.92%, currently priced at $2,123.08. The asset is trading beneath its EMA 20 ($2,137.00) and EMA 50 ($2,170.59). The RSI stands at 39.92, approaching the oversold threshold, which warrants close observation for potential consolidation. Primary resistance is identified at $2,151.90 and $2,248.20, while the immediate support floor is situated at $2,071.55.
3. Macro Confluence & Market Structure
Both assets are currently testing local support levels as they navigate a corrective phase. $BTC maintains relative strength compared to $ETH, which is currently experiencing higher volatility and a steeper percentage decline. The divergence in their respective RSI readings suggests that market participants are currently favoring the stability of the primary asset over the altcoin leader.
4. Community Discussion
Which asset do you expect to lead momentum this week: $BTC or $ETH? Share below! 👇
⚠️ Educational analysis only. Not financial advice (NFA). DYOR.
$BTC $ETH #BinanceSquare #CryptoMarket
1. Bitcoin $BTC Technical Outlook
The asset is currently trading at 74,657.08, reflecting a slight contraction of 1.58%. Price action remains positioned below both the EMA 20 (74,854.82) and EMA 50 (75,188.74), indicating a prevailing short-term bearish bias. With an RSI of 45.93, the asset is neither overbought nor oversold, suggesting a neutral momentum state. Key technical levels to monitor include the support floor at 73,630.00 and the overhead resistance zone at 76,119.72.
2. Ethereum $ETH Technical Outlook
Ethereum $ETH shows a more pronounced decline of 4.92%, currently priced at $2,123.08. The asset is trading beneath its EMA 20 ($2,137.00) and EMA 50 ($2,170.59). The RSI stands at 39.92, approaching the oversold threshold, which warrants close observation for potential consolidation. Primary resistance is identified at $2,151.90 and $2,248.20, while the immediate support floor is situated at $2,071.55.
3. Macro Confluence & Market Structure
Both assets are currently testing local support levels as they navigate a corrective phase. $BTC maintains relative strength compared to $ETH, which is currently experiencing higher volatility and a steeper percentage decline. The divergence in their respective RSI readings suggests that market participants are currently favoring the stability of the primary asset over the altcoin leader.
4. Community Discussion
Which asset do you expect to lead momentum this week: $BTC or $ETH? Share below! 👇
⚠️ Educational analysis only. Not financial advice (NFA). DYOR.
$BTC $ETH #BinanceSquare #CryptoMarket