
There are so many whales trading right now that the market is giving us no respite! If we look at the sentiment map and Smart Traders' positions on $SOXL , an army of 647 traders has built up a gigantic short position worth more than 231 million dollars, but they’re deep in the red, with losses exceeding 4.1 million.
At the other end, the longs (buyers), although fewer in number (214 traders with around 30 million at stake), are winning the battle and have recorded gains of more than 593,000 dollars.
If we zoom in on the flow over the last 30 minutes, large accounts and whales are still setting the pace, with 44 whales defending their long positions compared with 35 whales looking for a pullback to sell.
What do the chart and liquidity tell us?
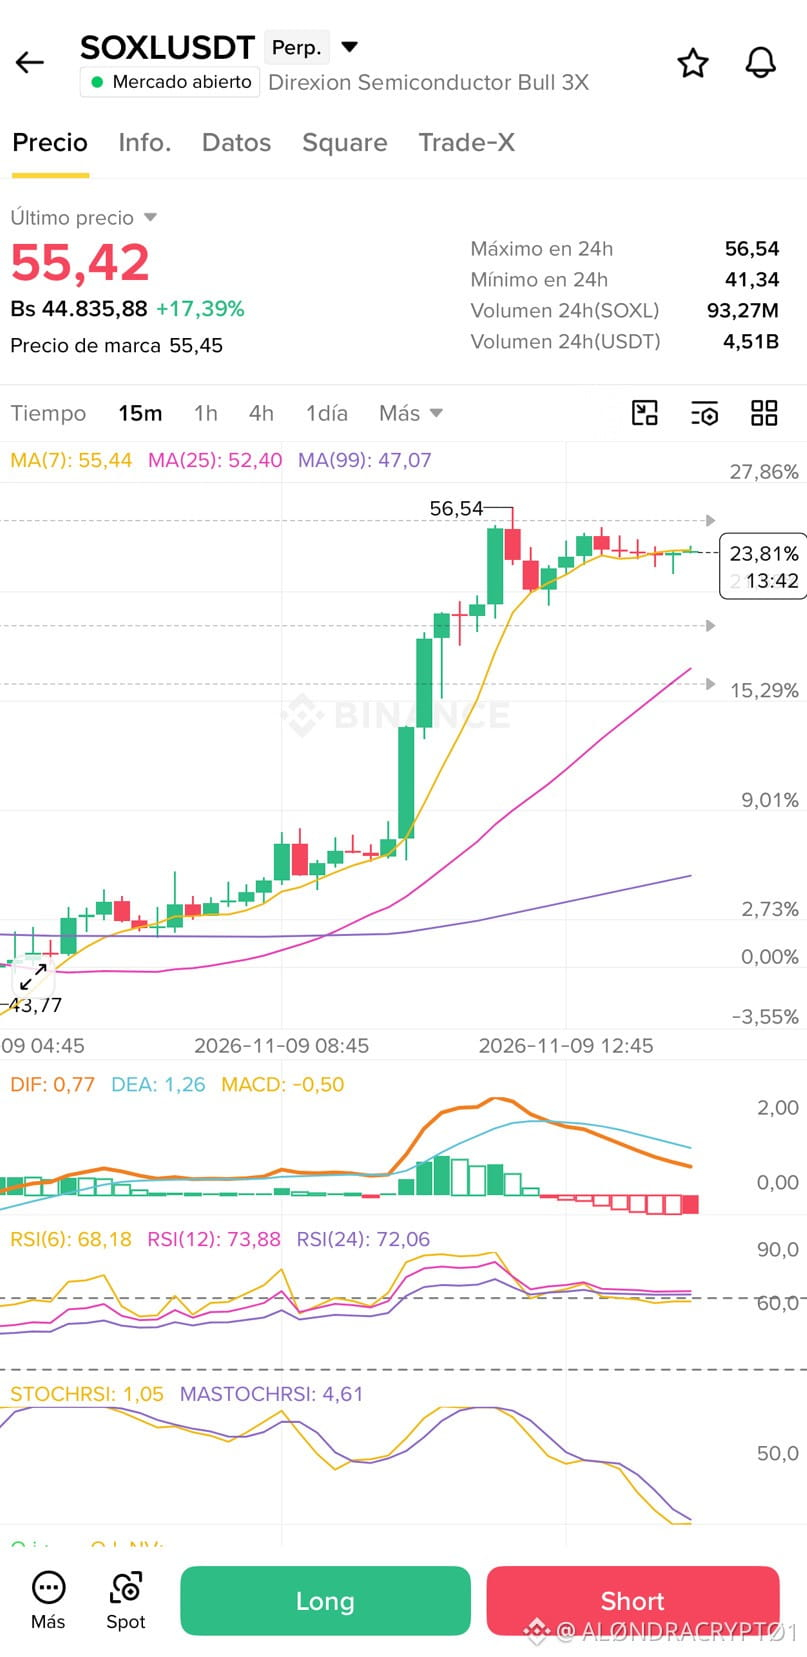
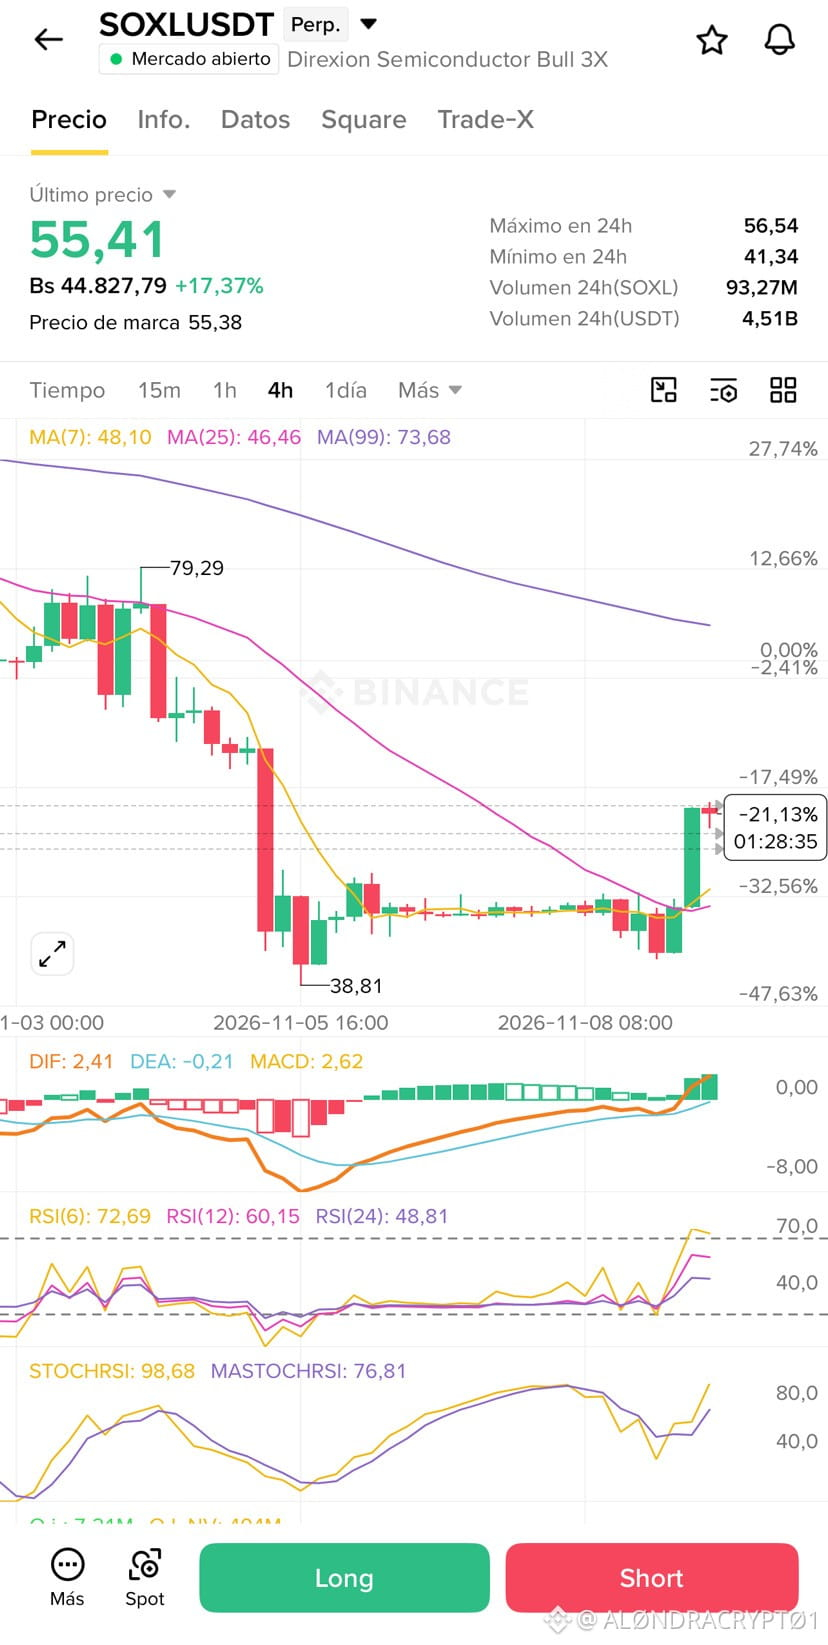
The current price is around 55.04 USD, posting a very strong daily rise of more than 16% and massive futures volume of over 4,500 million USDT. After that vertical rebound from the lows of 41.34 USD, the liquidation heatmap shows tremendous liquidity building up below, in the 45 to 47 USD zone, with denser blocks around 40–41 USD, acting like a magnet. Above, beyond 56.50 USD, we have resistance and a trail of liquidity where many shorts could be forced to close if the price breaks through decisively.
📌 Tactical Action Plan:
- For a long position (bullish continuation): If the price makes a healthy pullback to sweep liquidity, the zone between 52.00 and 53.50 USD is key for looking for support with volume. The target (TP) is 58.00 USD, where we can hunt down trapped shorts, while maintaining a strict Stop Loss (SL) below 49.50 USD.
- For a short position (rejection at resistance): If the price hits the liquidity ceiling at 56.50 USD and 59.20 and loses the fast moving averages without buying volume, we could see a rapid correction toward the 52.00 or 48.50 USD zone, with a strict Stop Loss above 57.50 USD.
DYOR
At the other end, the longs (buyers), although fewer in number (214 traders with around 30 million at stake), are winning the battle and have recorded gains of more than 593,000 dollars.
If we zoom in on the flow over the last 30 minutes, large accounts and whales are still setting the pace, with 44 whales defending their long positions compared with 35 whales looking for a pullback to sell.
What do the chart and liquidity tell us?
The current price is around 55.04 USD, posting a very strong daily rise of more than 16% and massive futures volume of over 4,500 million USDT. After that vertical rebound from the lows of 41.34 USD, the liquidation heatmap shows tremendous liquidity building up below, in the 45 to 47 USD zone, with denser blocks around 40–41 USD, acting like a magnet. Above, beyond 56.50 USD, we have resistance and a trail of liquidity where many shorts could be forced to close if the price breaks through decisively.
📌 Tactical Action Plan:
- For a long position (bullish continuation): If the price makes a healthy pullback to sweep liquidity, the zone between 52.00 and 53.50 USD is key for looking for support with volume. The target (TP) is 58.00 USD, where we can hunt down trapped shorts, while maintaining a strict Stop Loss (SL) below 49.50 USD.
- For a short position (rejection at resistance): If the price hits the liquidity ceiling at 56.50 USD and 59.20 and loses the fast moving averages without buying volume, we could see a rapid correction toward the 52.00 or 48.50 USD zone, with a strict Stop Loss above 57.50 USD.
DYOR