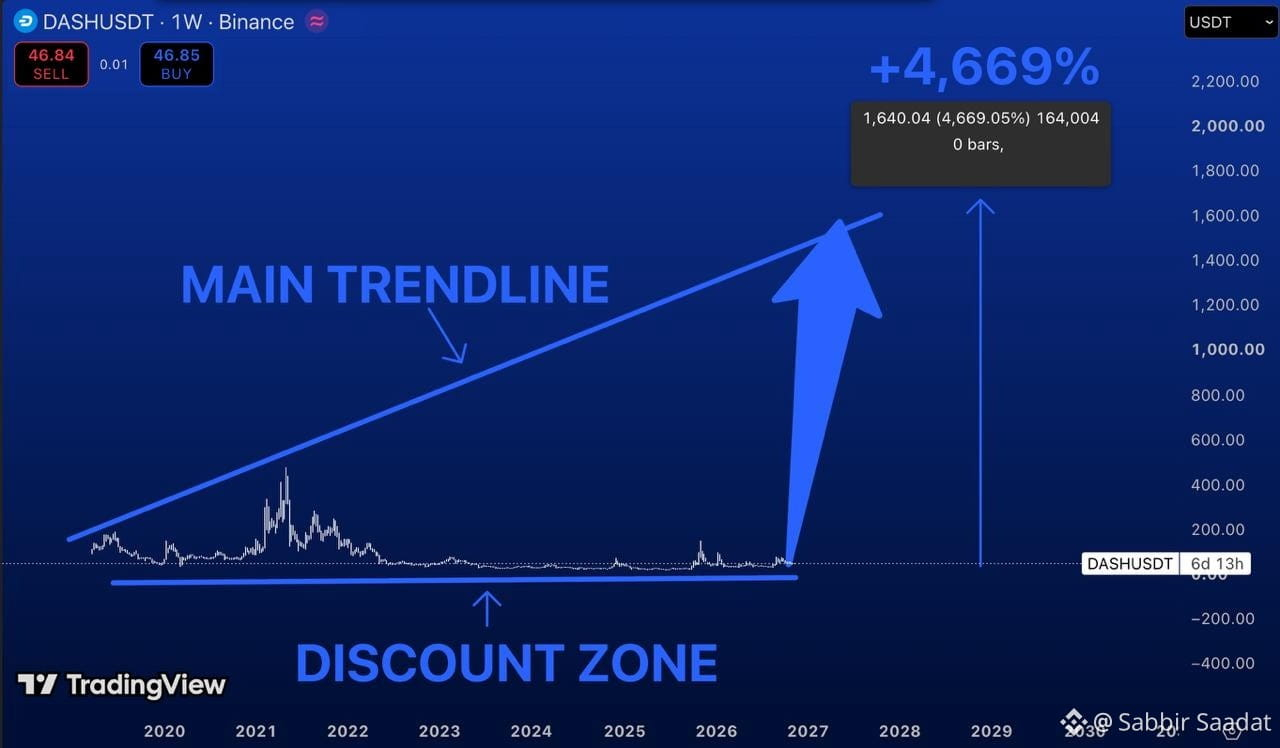
$DASH is trading around $47.
And I think this is one of those charts that most traders would scroll past without a second thought.
But zoom out to the weekly timeframe.
Back in 2021, $DASH rallied above $400.
Since then, it's spent years grinding lower, with every major recovery eventually getting sold.
Now price is sitting near a multi-year discount zone.
And that's where things get interesting.
The chart shows a long period of consolidation near the lows, with volatility gradually fading.
But here's what I want to see before getting too excited.
First, $DASH needs to reclaim $100.
Then $200–400 becomes the next major area to watch.
Above that, $800 and $1,000 could come into focus if a genuine long-term reversal develops.
And $1,600+? That's my extreme bull scenario.
The chart outlines a potential 4,669% rally from its marked lower reference point.
But a massive upside projection doesn't automatically make it a good trade.
The real confirmation would be a breakout from this multi-year base, followed by higher highs and higher lows.
Because right now, DASH is still a speculative recovery setup.
And whether this discount zone becomes the foundation for a new cycle or just another stop in a longer decline depends entirely on what buyers do next.
And I think this is one of those charts that most traders would scroll past without a second thought.
But zoom out to the weekly timeframe.
Back in 2021, $DASH rallied above $400.
Since then, it's spent years grinding lower, with every major recovery eventually getting sold.
Now price is sitting near a multi-year discount zone.
And that's where things get interesting.
The chart shows a long period of consolidation near the lows, with volatility gradually fading.
But here's what I want to see before getting too excited.
First, $DASH needs to reclaim $100.
Then $200–400 becomes the next major area to watch.
Above that, $800 and $1,000 could come into focus if a genuine long-term reversal develops.
And $1,600+? That's my extreme bull scenario.
The chart outlines a potential 4,669% rally from its marked lower reference point.
But a massive upside projection doesn't automatically make it a good trade.
The real confirmation would be a breakout from this multi-year base, followed by higher highs and higher lows.
Because right now, DASH is still a speculative recovery setup.
And whether this discount zone becomes the foundation for a new cycle or just another stop in a longer decline depends entirely on what buyers do next.