
$LINK A Triangle Breakout Could Trigger the Next Recovery Wave
Long Setup
Entry Zone: 10.620 – 10.700
Stop Loss: 10.450
TP1: 10.780
TP2: 11.146
TP3: 11.513
Market Analysis:
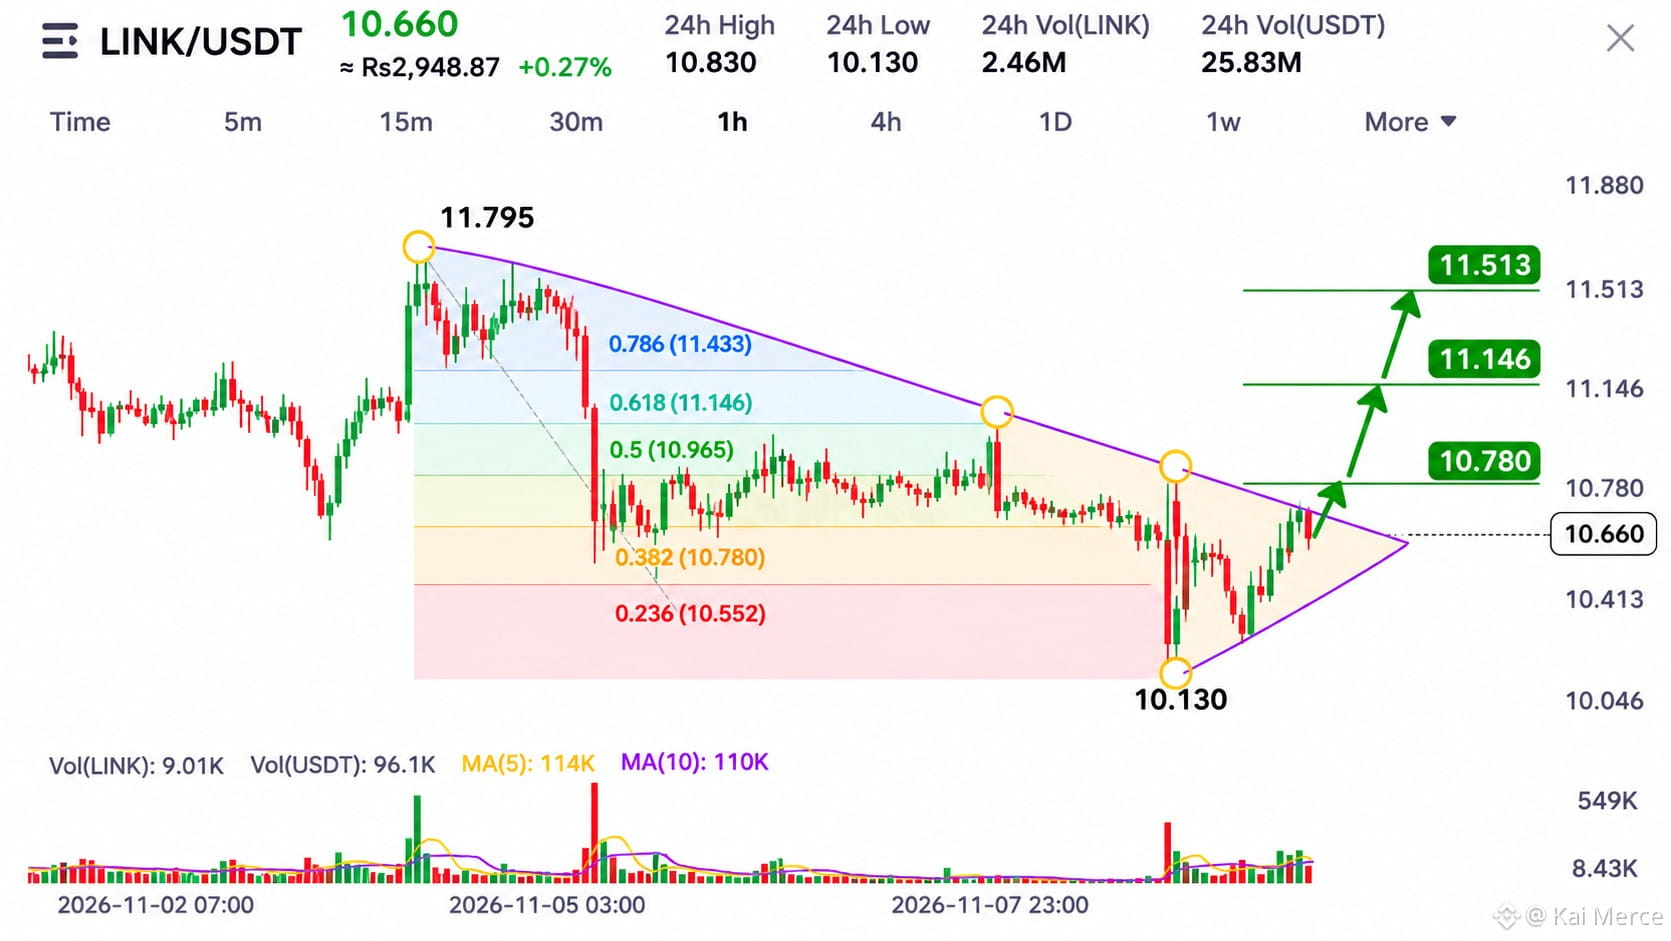
Chainlink is approaching a crucial technical turning point as price compresses inside a symmetrical triangle on the 1H chart.
After reaching 11.795, LINK entered a corrective phase, forming lower highs along descending resistance. Meanwhile, buyers established rising support after the price reached 10.130, creating a tightening structure between sellers and buyers.
The latest recovery toward 10.660 suggests that buying interest is returning. More importantly, price is approaching the upper boundary of the triangle, where a breakout could change the short-term market structure.
The Fibonacci levels provide additional confirmation zones. The 10.780 resistance is the first important hurdle. A successful breakout above this level could open the way toward 11.146, followed by 11.513.
Key Technical Levels:
- Current Price: 10.660
- Major Support: 10.130
- First Resistance: 10.780
- Second Resistance: 11.146
- Major Target: 11.513
- Previous Swing High: 11.795
Why This Setup Matters:
The symmetrical triangle reflects market compression, with buyers gradually pushing higher while sellers continue defending descending resistance.
A strong breakout accompanied by increasing volume could provide the momentum needed for another recovery leg. However, rejection at the triangle's upper boundary could lead to another pullback toward rising support.
Confirmation: A strong 1H candle close above 10.780 with increasing volume.
Invalidation: A decisive breakdown below 10.450 would weaken the bullish setup.
LINK is approaching a decisive moment. The next confirmed move could determine whether this consolidation develops into a larger bullish recovery.
Trade with discipline, protect your capital, and never treat projected targets as guaranteed outcomes.
Long Setup
Entry Zone: 10.620 – 10.700
Stop Loss: 10.450
TP1: 10.780
TP2: 11.146
TP3: 11.513
Market Analysis:
Chainlink is approaching a crucial technical turning point as price compresses inside a symmetrical triangle on the 1H chart.
After reaching 11.795, LINK entered a corrective phase, forming lower highs along descending resistance. Meanwhile, buyers established rising support after the price reached 10.130, creating a tightening structure between sellers and buyers.
The latest recovery toward 10.660 suggests that buying interest is returning. More importantly, price is approaching the upper boundary of the triangle, where a breakout could change the short-term market structure.
The Fibonacci levels provide additional confirmation zones. The 10.780 resistance is the first important hurdle. A successful breakout above this level could open the way toward 11.146, followed by 11.513.
Key Technical Levels:
- Current Price: 10.660
- Major Support: 10.130
- First Resistance: 10.780
- Second Resistance: 11.146
- Major Target: 11.513
- Previous Swing High: 11.795
Why This Setup Matters:
The symmetrical triangle reflects market compression, with buyers gradually pushing higher while sellers continue defending descending resistance.
A strong breakout accompanied by increasing volume could provide the momentum needed for another recovery leg. However, rejection at the triangle's upper boundary could lead to another pullback toward rising support.
Confirmation: A strong 1H candle close above 10.780 with increasing volume.
Invalidation: A decisive breakdown below 10.450 would weaken the bullish setup.
LINK is approaching a decisive moment. The next confirmed move could determine whether this consolidation develops into a larger bullish recovery.
Trade with discipline, protect your capital, and never treat projected targets as guaranteed outcomes.