
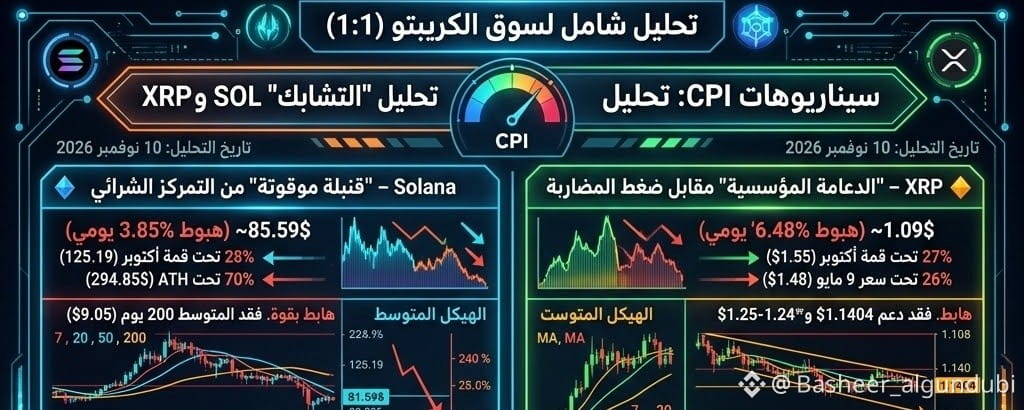

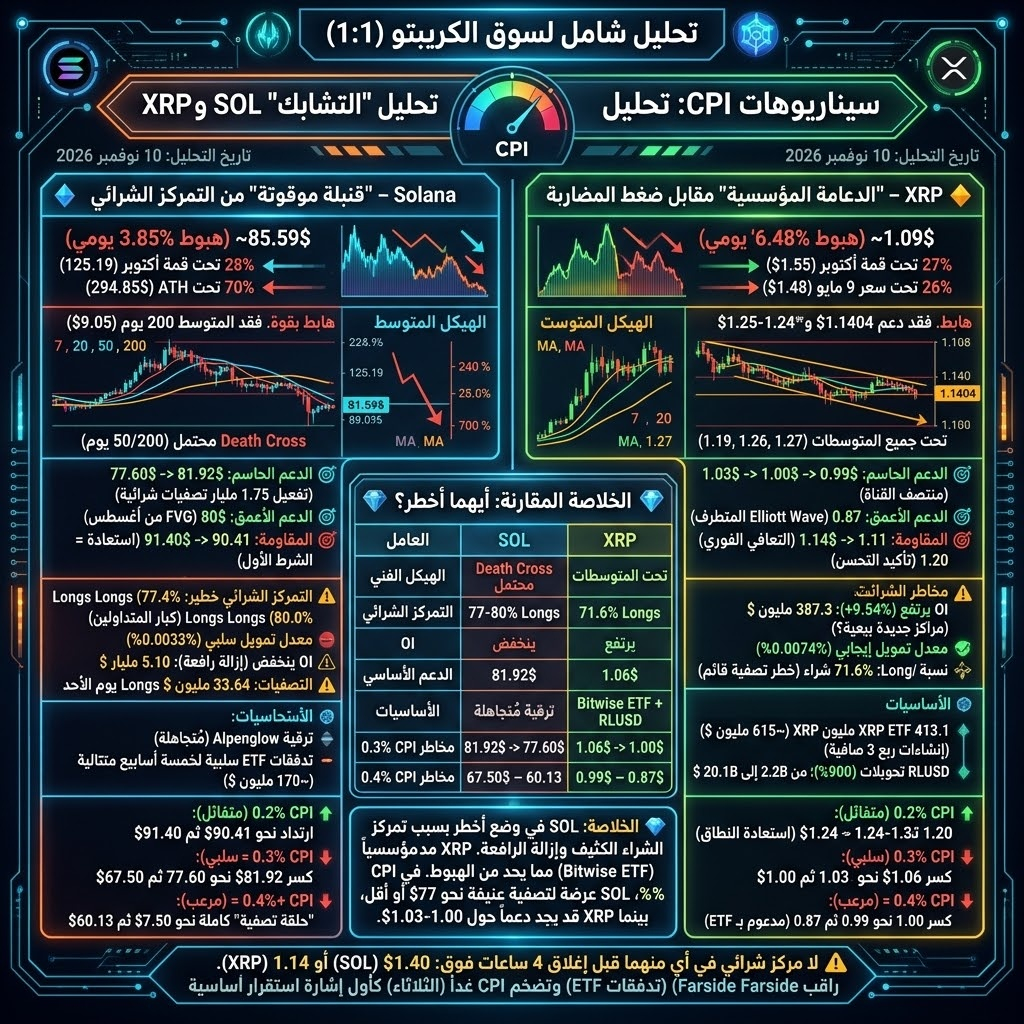
This reflects the “entanglement” I mentioned earlier: both are facing severe selling pressure, but #SOLUSDT is more exposed to liquidation risk because of its heavy long positioning, while #XRPUSDT has a fundamental support (#Bitwise ETF) that may limit the depth of the decline. Here’s the breakdown:
🔷 First: Solana ( #SOL ) – “A ticking time bomb” of long positioning
Current price: ~$85.59 (down 3.85% on the day), after trading between $85.02 and $90.01. The price is now **28% below the October peak** ($125.19) and 70% below its all-time high ($294.85 in January 2025).
Market structure: strongly bearish. SOL has lost the 200-day moving average (89.05$) and is now below all moving averages (7-day: 91.25$, 20-day: 97.47$, 50-day: 107.35$). This means any rebound faces a cloud of resistance, not just a single level. A Death Cross between the 50-day and 200-day moving averages is imminent, confirming the bearish trend structurally.
Critical liquidity zones:
· Key support: 81.92$** (strong support), then **77.60$. A break below $78 could trigger $1.75 billion in long liquidations.
· Deeper support: 80$ is the "fair value gap" (FVG) from August and could attract price as it seeks liquidity before any genuine rebound.
· Resistance: 90.41$** (broken trendline), then **91.40$ (0.618 Fibonacci level). Reclaiming 91.40$ on a daily close is the first condition for changing the bearish structure.
Derivatives (the greatest risk):
· Long positioning is dangerous: 77.4% of Binance accounts are long, as are 80.0% of top traders.
· The funding rate is negative (-0.0033%): sellers are paying buyers, confirming current selling pressure but not, by itself, a reversal.
· OI is falling: it has dropped to $5.10 billion (its lowest level since August 19), indicating deleveraging rather than new positions being opened.
· Liquidations: $33.64 million in long liquidations on Sunday, versus just $1.35 million in short liquidations — the bulls are taking the hit.
Fundamentals (positive but ignored): Solana completed the #Alpenglow upgrade (the largest rewrite of its consensus system since launch), but the market completely ignored it amid the sell-off. ETF flows have been negative for five consecutive weeks (~$170 million), and October alone saw $144 million in outflows — the first negative monthly flow in 13 months.
CPI scenarios for SOL:
· CPI ≤ 0.2% (bullish): A potential mechanical rebound toward 90.41$** and then **91.40$. But without a daily close above 91.40$, it remains just a rebound within a downtrend. Reclaiming 91.40$ could open the way to 97.85$ (0.5 Fibonacci level).
· CPI = 0.3% (bearish): A break below 81.92$** is possible, triggering accumulated long liquidations. The next target is **77.60$, then 67.50$.
· CPI = 0.4%+ (terrifying): A full "liquidation cascade." A rapid break below 77.60$ could send the price to **67.50$** and then 60.13$ within days, with the funding rate turning even more negative.
🔶 Second: XRP – "Institutional support" versus speculative pressure
Current price: ~$1.09 (down 6.48% on the day), after trading between $1.17 and $1.08. The price is **27% below the October high** ($1.55) and 26% below the May 9 price ($1.48).
Market structure: bearish. XRP is below all moving averages (7-day: 1.19$, 20-day: 1.26$, 50-day: 1.37$, 200-day: 1.27$). It has lost support at 1.1404$** (the lower bound of the previous range) and **the 1.24-1.25$ support zone, indicating that the broader structure (June–August) may have broken.
Critical liquidity zones:
· Key support: 1.06$** (immediate support), then **1.03$ (strong support). A break below 1.06$ opens the way toward **1.00$** and then 0.99$ (midpoint of the descending channel).
· Deeper support: 0.87$ is the "extreme" target if everything fails, according to Elliott Wave analysis.
· Resistance: 1.11$** (pivot point + lower Bollinger band) is the first hurdle. **1.14$ (immediate resistance) is the "first condition" for recovery. 1.20$ (strong resistance) would confirm improvement.
Derivatives (conflicting signals):
· OI is rising: +9.54% to $387.3 million, indicating new positions are being opened. But the long/short ratio over the last hour is 0.8755 (more selling than buying), suggesting the new positions may be short positions.
· The funding rate is slightly positive (+0.0074%): buyers are paying a small premium, but this does not confirm bullish conviction.
· Long/Short ratio: 71.6% of global accounts are long (based on previous analysis), keeping the risk of long liquidations in play.
Fundamentals (real support): Bitwise XRP ETF reported holdings of 413.1 million XRP (worth ~$615 million) on September 30, with positive net creations in Q3 (150.2 million XRP created versus 23.7 million redeemed). RLUSD transfer volume on XRPL also rose 900% (from $2.2 billion in January to $20.1 billion in October). This support makes XRP less vulnerable to a deep collapse than SOL, but it does not prevent short-term declines.
CPI scenarios for XRP:
· CPI ≤ 0.2% (bullish): A rebound toward 1.14$** first. A breakout above it opens the way to **1.20$. Only above 1.20$ does discussion of **1.24-1.25$** (reclaiming the broken range) begin, followed by 1.30$ (a potential 13% target).
· CPI = 0.3% (bearish): A break below 1.06$** is possible, targeting **1.03$ and then 1.00$. This scenario is supported by skewed long positioning and weak buying flows.
· CPI = 0.4%+ (terrifying): A break below 1.00$ could open the way to **0.99$** (channel midpoint), then 0.87$. But institutional support (Bitwise ETF) may slow the decline compared with SOL.
💎 Comparative conclusion: Which is riskier?
Factor SOL XRP
Technical structure Strongly bearish (potential Death Cross) Bearish (below all moving averages)
Long positioning Extremely risky (77-80% longs) Elevated (71.6% longs)
OI Falling (deleveraging) Rising (new positions)
Key support 81.92$ ($1.75 billion in liquidations below it) **1.06$** (a break opens the way to 1.00$)
Fundamentals Alpenglow upgrade (ignored) Bitwise ETF (413 million XRP) + RLUSD
CPI 0.3% risk Break below 81.92$ → 77.60$ Break below 1.06$ → 1.00$
CPI 0.4%+ risk 67.50$ – 60.13$ (severe liquidations) 0.99$ – 0.87$ (partially supported by ETF)
Conclusion: SOL is in a riskier position due to heavy long positioning (77-80%) and previously elevated OI, while XRP has fundamental support (Bitwise ETF) that may limit the depth of the decline. In a CPI scenario of 0.3% or higher, SOL is more vulnerable to a sharp liquidation wave that could push it to $77 or lower, while XRP may find relative support around 1.00-1.03$. Avoid taking long positions in either asset until a 4-hour close above 91.40$ (SOL) or 1.14$ (XRP) is confirmed, while monitoring ETF flows daily (a halt in outflows = the first sign of stabilization).

