$ETH Crypto Academician: 11.10 Ethereum (ETH) was precisely pierced and then bounced back—are they shaking out holders or putting in a top?
Since ETH pulled back from its 2,806 high, the cumulative decline has reached 24%, and market sentiment has rapidly shifted from FOMC to Fear. Many people ask me: Is this a trend reversal or an intermediate correction? I won't jump straight to a conclusion. Instead, I'll break down the current daily and 4-hour structures using four perspectives: the EMA system, MACD momentum, Bollinger Bands, and the TD Sequential. This article is for those willing to spend time studying the charts. Follow me for ongoing analysis of multi-timeframe confluence, key-level identification, and risk/reward calculations. First, a disclaimer: The following is solely my personal technical analysis and does not constitute investment advice.
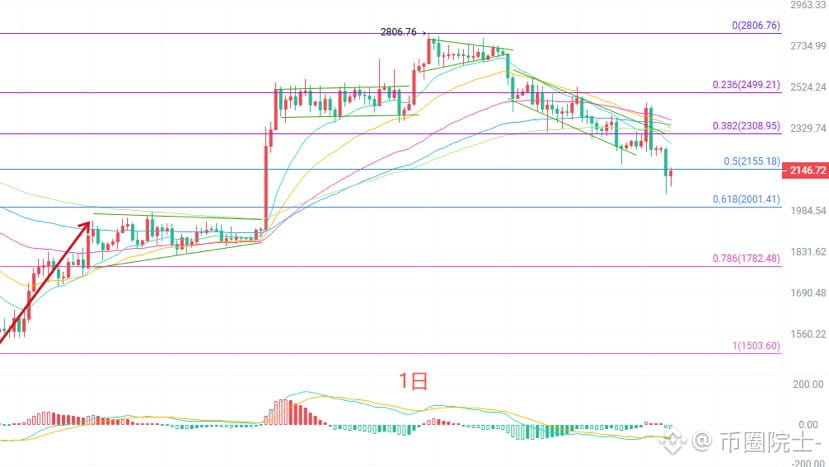
The daily candlestick is a doji with a long lower shadow, indicating buying interest around 2,080. But the moving-average structure looks poor: at 2,131, the price has fallen below all the short- and medium-term EMAs—EMA15 at 2,263, EMA30 at 2,333, and EMA60 at 2,370—a classic bearish alignment. Downward MACD momentum has not fully run its course. The lower Bollinger Band at 2,121 was briefly pierced intraday before the price recovered. This is a key battleground between bulls and bears: holding here would mean an oversold rebound; breaking below it would mean another leg down.
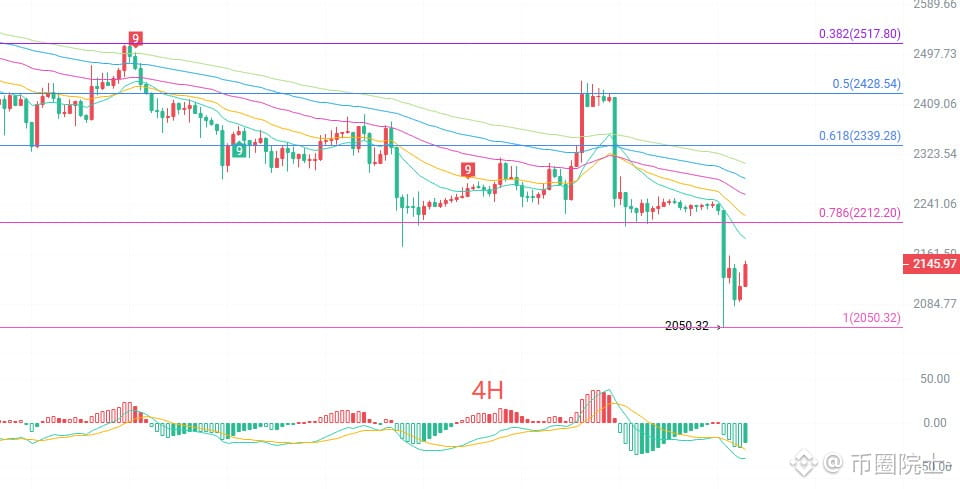
The 4-hour candlestick is the strongest one since the rally in August. The price is now 2,131, below all the EMAs, which are in a perfect bearish alignment. MACD is below the zero line, and the green histogram bars show DIF continuing to cross below DEA, with no sign of a short-term bullish crossover. The lower Bollinger Band is at 2,105, and the price is hugging it. The bands are widening, indicating that the trending decline is not over yet. A TD signal has appeared, and any rebound is likely to face pressure at successive levels.
Short-term levels to watch:
Long: If support holds in the 2,100–2,050 range, stop-loss at 30 points; targets at 2,185–2,220.
Short: If the price stalls in the 2,220–2,270 range, stop-loss at 30 points; targets at 2,150–2,100.
For specific trades, prioritize real-time market data. For more information, you can contact the author. Articles are published with a delay; these are suggestions only, and you assume all risks.
#ETH走势分析
Since ETH pulled back from its 2,806 high, the cumulative decline has reached 24%, and market sentiment has rapidly shifted from FOMC to Fear. Many people ask me: Is this a trend reversal or an intermediate correction? I won't jump straight to a conclusion. Instead, I'll break down the current daily and 4-hour structures using four perspectives: the EMA system, MACD momentum, Bollinger Bands, and the TD Sequential. This article is for those willing to spend time studying the charts. Follow me for ongoing analysis of multi-timeframe confluence, key-level identification, and risk/reward calculations. First, a disclaimer: The following is solely my personal technical analysis and does not constitute investment advice.
The daily candlestick is a doji with a long lower shadow, indicating buying interest around 2,080. But the moving-average structure looks poor: at 2,131, the price has fallen below all the short- and medium-term EMAs—EMA15 at 2,263, EMA30 at 2,333, and EMA60 at 2,370—a classic bearish alignment. Downward MACD momentum has not fully run its course. The lower Bollinger Band at 2,121 was briefly pierced intraday before the price recovered. This is a key battleground between bulls and bears: holding here would mean an oversold rebound; breaking below it would mean another leg down.
The 4-hour candlestick is the strongest one since the rally in August. The price is now 2,131, below all the EMAs, which are in a perfect bearish alignment. MACD is below the zero line, and the green histogram bars show DIF continuing to cross below DEA, with no sign of a short-term bullish crossover. The lower Bollinger Band is at 2,105, and the price is hugging it. The bands are widening, indicating that the trending decline is not over yet. A TD signal has appeared, and any rebound is likely to face pressure at successive levels.
Short-term levels to watch:
Long: If support holds in the 2,100–2,050 range, stop-loss at 30 points; targets at 2,185–2,220.
Short: If the price stalls in the 2,220–2,270 range, stop-loss at 30 points; targets at 2,150–2,100.
For specific trades, prioritize real-time market data. For more information, you can contact the author. Articles are published with a delay; these are suggestions only, and you assume all risks.
#ETH走势分析