$MET: High Volume Doji Near Resistance
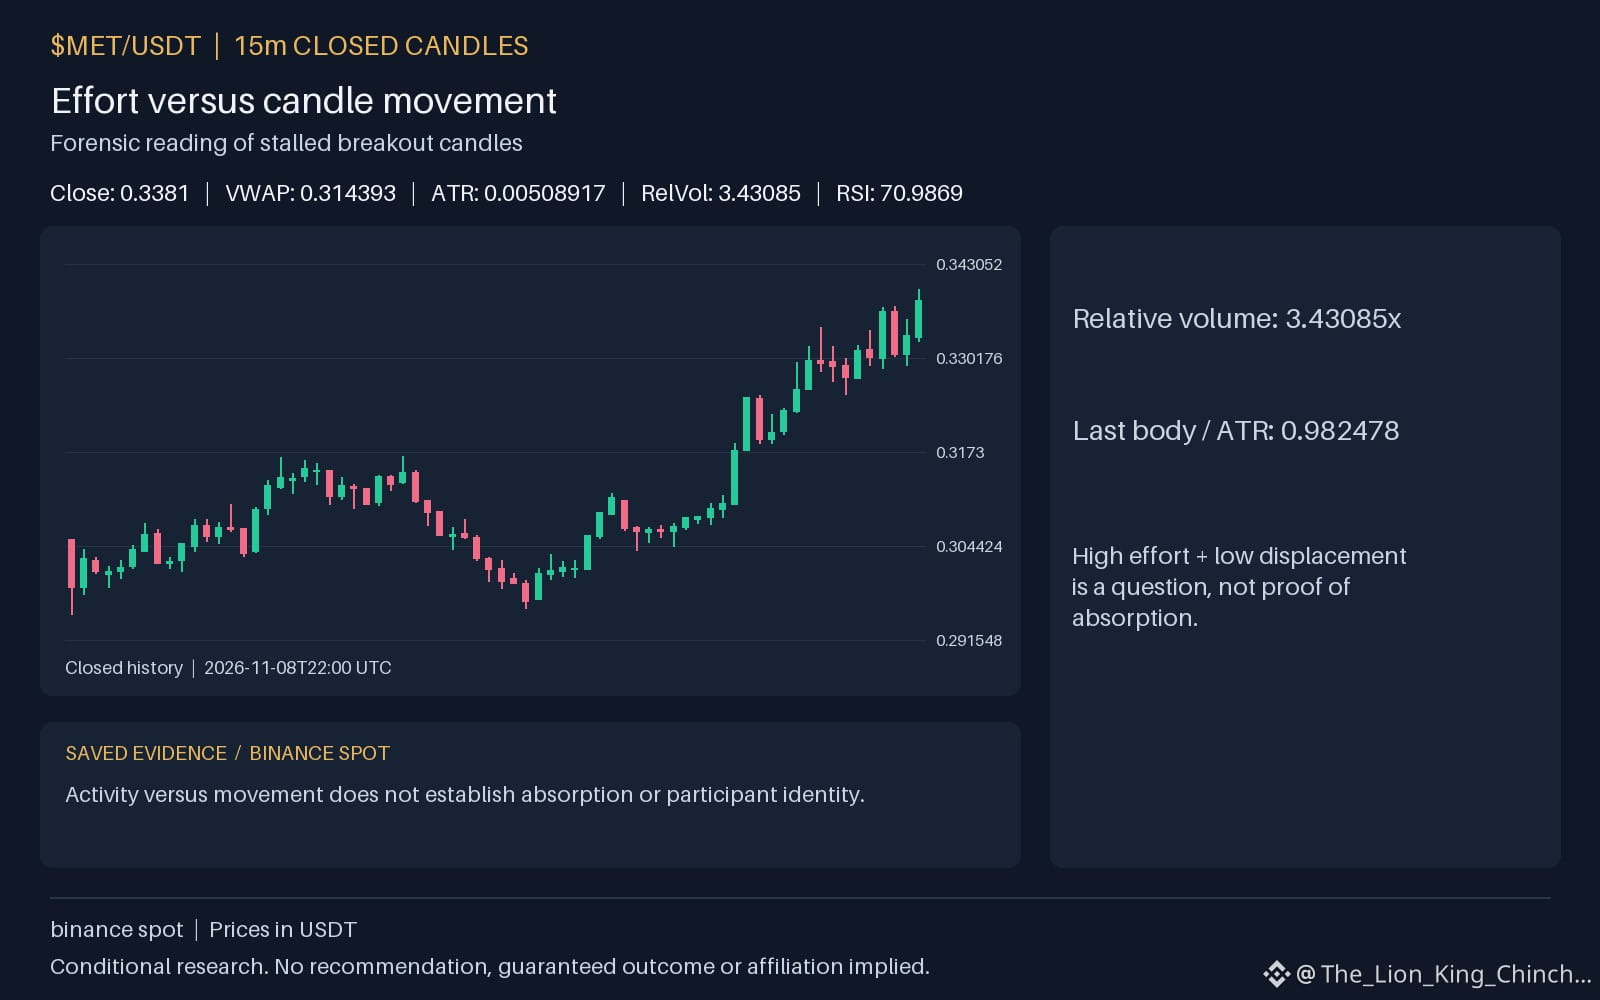
What distinguishes a successful breakout from a stalled attempt with elevated relative volume 3.43085? The core question is whether the candle structure signals completion or hesitation. We observe $MET trading above resistance 0.3372 with an hourly direction up. This creates a forensic puzzle about market structure rather than intent. Consider a hypothetical mechanism where high volume coinciding with price stalling near a key level suggests conflicting trading interest. In this thought experiment, the candle does not prove trader psychology or order flow. It only describes a visible pattern on the chart. The data shows daily volume 2.81744e+06 and a change 11.1805. These facts frame the context without explaining why the price moved. A clean close would support the interpretation that buyers absorbed supply effectively. Conversely, a patient retest might indicate that the initial push lacked sufficient momentum to sustain levels. If the price fails to hold above 0.3372, the stalled candle appears as a warning signal rather than a continuation cue. This weakening condition requires observing future price action relative to the previous high. We must avoid inferring hidden motives or specific trader behaviors from this single observation. The evidence is limited to the provided metrics and does not include order book depth or liquidation data. Therefore, any conclusion remains conditional and speculative until further confirmation emerges. To reassess this interpretation, check whether subsequent candles confirm the breakout or reverse toward support 0.3044. The moving averages at 0.325528 and 0.317319 provide additional structural context but do not validate the candle itself independently. Keep the analysis focused on the visible data and its potential readings without adding unverified narratives.
Probabilistic market research, not a recommendation or guaranteed return.
What would convince you: a clean close or a patient retest?
#MET
What distinguishes a successful breakout from a stalled attempt with elevated relative volume 3.43085? The core question is whether the candle structure signals completion or hesitation. We observe $MET trading above resistance 0.3372 with an hourly direction up. This creates a forensic puzzle about market structure rather than intent. Consider a hypothetical mechanism where high volume coinciding with price stalling near a key level suggests conflicting trading interest. In this thought experiment, the candle does not prove trader psychology or order flow. It only describes a visible pattern on the chart. The data shows daily volume 2.81744e+06 and a change 11.1805. These facts frame the context without explaining why the price moved. A clean close would support the interpretation that buyers absorbed supply effectively. Conversely, a patient retest might indicate that the initial push lacked sufficient momentum to sustain levels. If the price fails to hold above 0.3372, the stalled candle appears as a warning signal rather than a continuation cue. This weakening condition requires observing future price action relative to the previous high. We must avoid inferring hidden motives or specific trader behaviors from this single observation. The evidence is limited to the provided metrics and does not include order book depth or liquidation data. Therefore, any conclusion remains conditional and speculative until further confirmation emerges. To reassess this interpretation, check whether subsequent candles confirm the breakout or reverse toward support 0.3044. The moving averages at 0.325528 and 0.317319 provide additional structural context but do not validate the candle itself independently. Keep the analysis focused on the visible data and its potential readings without adding unverified narratives.
Probabilistic market research, not a recommendation or guaranteed return.
What would convince you: a clean close or a patient retest?
#MET