


$BNB Market Analysis and Short-Term Price Outlook
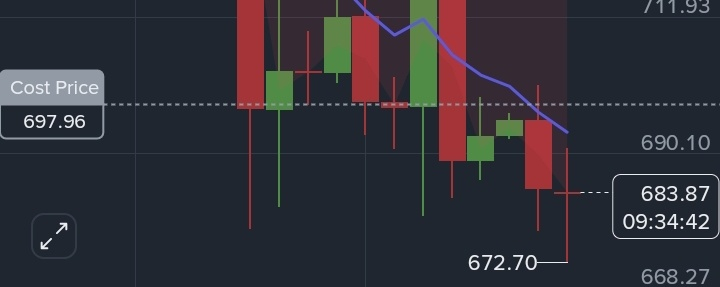
The user-provided chart illustrates the $BNB /USDC trading pair on Binance, showing the price at $683.87, down by 1.70% on the day. Below is a macro breakdown incorporating the latest international developments, security updates, and technical chart indicators.
🌐 Macro Environment & Geopolitical Impact
• Political Shifts & Policy Delays: Following recent U.S. midterm elections, a democratic control over both the House and Senate has sparked regulatory caution among institutional crypto investors. Concerns over more stringent oversight and potential delays of major crypto framework bills (such as the CLARITY Act) have induced broader market stagnation.
• A.I. Market Contagion: Broader risk-on assets are seeing local corrections due to tech-sector headwinds, particularly security and legal updates surrounding major technology leaders like Nvidia.
• Capital Rotation: Broad crypto assets are correcting downward. Bitcoin recently breached key support zones to trade under $75,000, pulling large-cap altcoins down by correlation.
📊 BNB Ecosystem & On-Chain Activities
• Security Recovery: Binance has actively stabilized user sentiment following an October security incident by introducing full zero-knowledge proof of reserves (covering assets like BNB, BTC, and ETH at a 1:1 ratio).
• Infrastructure Upgrades: BNB Chain remains highly active, recording 4.86 million active addresses over a 24-hour window. A critical state-root hotfix was recently successfully patched to protect validators, while anticipation builds around the upcoming Jenner hard fork scheduled for early December to implement prioritized network payment lanes.
• Institutional Changes: SkyBridge Capital founder Anthony Scaramucci recently joined the BNB Standard Board, strengthening the token’s prospects for institutional adoption despite recent short-term asset drain corrections.
📉 Technical Chart Analysis
• Trend Direction: The chart exhibits short-term bearish structure with consecutive downward red daily candles slicing below the 7-period EMA ($693.52).
• Support & Resistance Zones:
• Immediate Support: The price is testing the $681 – $684 horizontal shelf. If failed, the next structural daily wick defense line lies down at $672.70.
• Immediate Resistance: Reclaiming the $697.96 cost price baseline and the $701 pivot point is essential to shift the immediate trend back to neutral.
🔮 Strong Short-Term Price Prediction
Given the broader market drawdown, Bitcoin's break below $75,000, and immediate selling pressure on the daily time frame, BNB is expected to remain under pressure over the next few days.
• Bearish/Sideways Outlook: The asset is likely to consolidate or experience a slight breakdown toward the $672 - $677 support floor before finding sufficient buying liquidity.
• Bullish Invalidation: If broader market liquidations cool down, a daily close above $701 will invalidate the bearish bias and put a target back on the $719 - $723 resistance band.
🪙 Binance Coin ($BNB ) Official Identity
Below is the official visual branding reference for the asset analyzed:
Disclaimer: This overview and analysis is for educational purposes only and does not constitute formal financial advice. Digital as
set markets are highly volatile.#UKBanksCanNowApplyToConductCryptoAssetBusiness #CPITestsDecemberRateOutlook #BitcoinFiveWeeklyLosses