🚨$ONE /USDT Perp — Rebound opportunity in the extreme oversold zone or continued downside? 📉🔍
Let's take a look at the 15-minute ONE/USDT (Perpetual) chart to analyze current market movements:
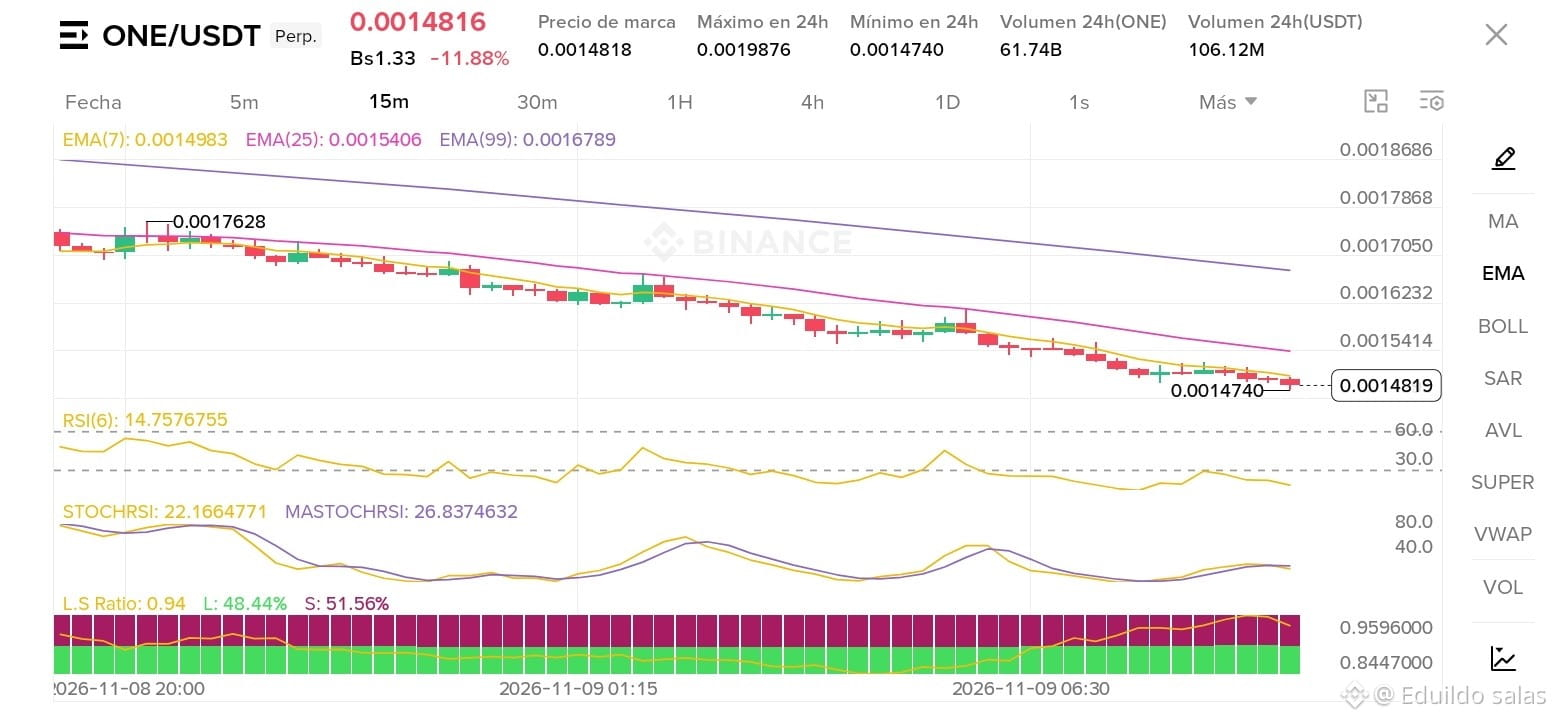
Current price: $0.0014816 USDT (-11.88% over the last 24 hours).
24h range: High of $0.0019876 and recent low of $0.0014740.
Volume: Very active, with 61.74B ONE and 106.12M USDT traded today.
Quick technical analysis:
Moving Averages (EMA): The EMAs (EMA 7 at $0.0014983, EMA 25 at $0.0015406, and EMA 99 at $0.0016789) maintain a clear downtrend, acting as dynamic resistance above the price.
RSI (6): At 14.75, indicating extreme oversold conditions. This suggests that selling pressure has been massive in the short term.
StochRSI: The lines are crossing in the lower zone (~22 / 26), suggesting we could see a relief attempt or a short-term technical rebound, although the chart's broader trend continues to weigh on the price.
Long/Short Ratio: At 0.94 (Longs: 48.44% / Shorts: 51.56%), reflecting a slight bearish bias, but with a fairly contested market.
💡 Conclusion for traders: The price is testing 24-hour lows near support at $0.00147. With the RSI so depressed, are we looking at a local bottom ready to rebound, or will the decline continue? Keep a close eye on the order book!
How are you trading this move? Let me know in the comments! 👇💬
#ONE #BinanceSquare #NvidiaInvestigatesAfterHuang’sAffairApology
Let's take a look at the 15-minute ONE/USDT (Perpetual) chart to analyze current market movements:
Current price: $0.0014816 USDT (-11.88% over the last 24 hours).
24h range: High of $0.0019876 and recent low of $0.0014740.
Volume: Very active, with 61.74B ONE and 106.12M USDT traded today.
Quick technical analysis:
Moving Averages (EMA): The EMAs (EMA 7 at $0.0014983, EMA 25 at $0.0015406, and EMA 99 at $0.0016789) maintain a clear downtrend, acting as dynamic resistance above the price.
RSI (6): At 14.75, indicating extreme oversold conditions. This suggests that selling pressure has been massive in the short term.
StochRSI: The lines are crossing in the lower zone (~22 / 26), suggesting we could see a relief attempt or a short-term technical rebound, although the chart's broader trend continues to weigh on the price.
Long/Short Ratio: At 0.94 (Longs: 48.44% / Shorts: 51.56%), reflecting a slight bearish bias, but with a fairly contested market.
💡 Conclusion for traders: The price is testing 24-hour lows near support at $0.00147. With the RSI so depressed, are we looking at a local bottom ready to rebound, or will the decline continue? Keep a close eye on the order book!
How are you trading this move? Let me know in the comments! 👇💬
#ONE #BinanceSquare #NvidiaInvestigatesAfterHuang’sAffairApology