A fatal signal: the bull market for $ETH is most likely already dead
Let’s review Ethereum’s daily moving averages and compare the timing of the first and second waves in previous bull markets, then share a few observations that may help you let go of your bull-market fixation.
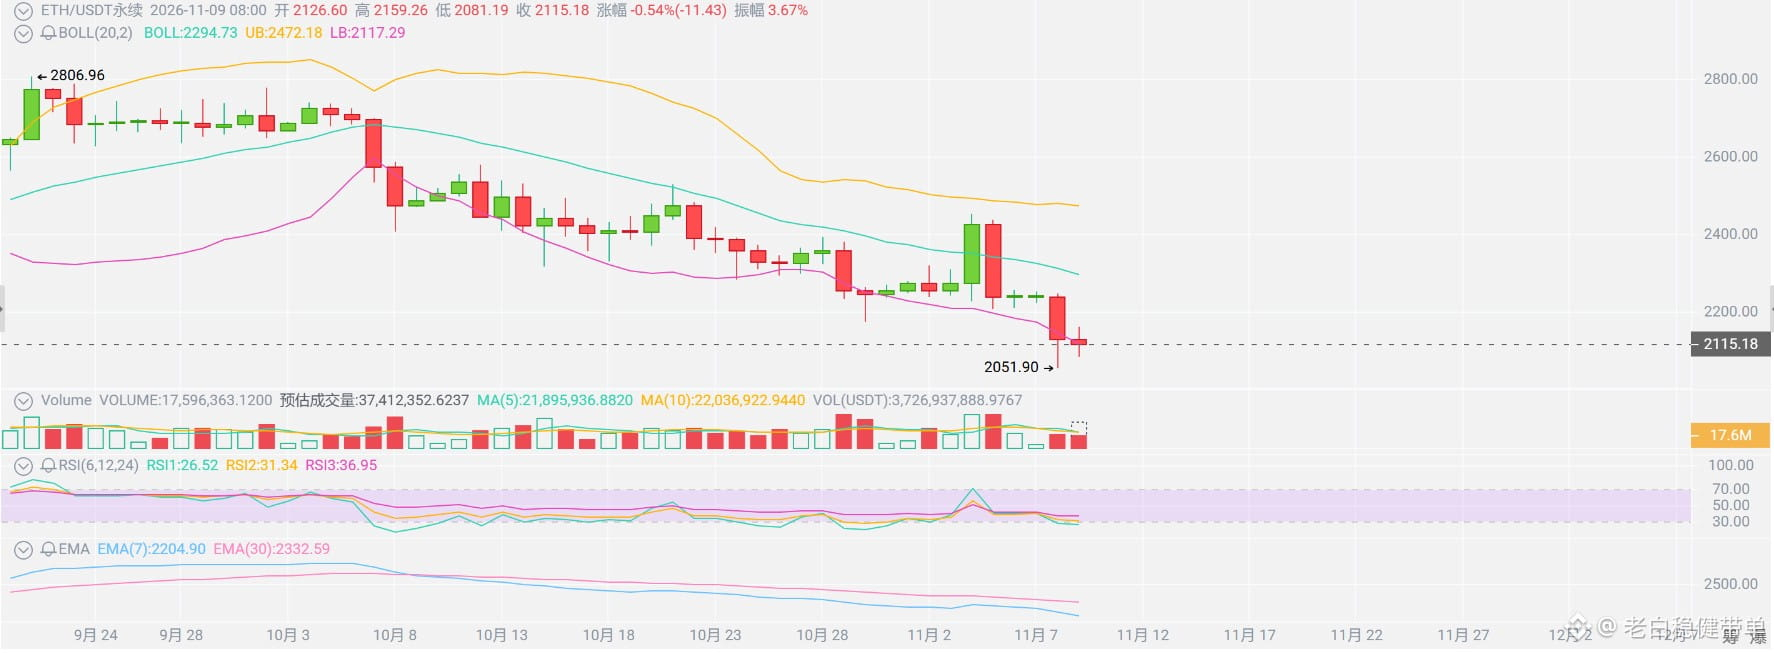
First, the daily moving averages have formed a bearish alignment. Looking back at history, this structure has rarely appeared during the genuine upward phase of a bull market. It is a strong warning sign in itself.
Second, the timing doesn’t match a standard second wave. The first wave of this cycle took about a month to get underway, while the current correction has already lasted a month and a half. In past bull markets, the first wave typically lasted 2–3 times as long as the second wave, and corrections rarely lasted longer than the first wave. In terms of timing, this looks more like the main downward wave than a buildup before a rebound.
Third, the way the market sold off at key support levels doesn’t look right. The previous drops to 2155 and 2078 came after sideways trading over the weekend, followed by a rapid plunge, mostly liquidating highly leveraged positions. There wasn’t the kind of full-blown panic washout you’d expect. A convincing market bottom often requires thoroughly crushing bullish sentiment. Given the current price action, 2050 is unlikely to be the start of a major upward move.
Overall, a short-term rebound isn’t out of the question, but don’t set your expectations too high. First, watch 2204 on the upside. If momentum is strong, the upper limit is probably around 2330; it’s unlikely to open up room for a major rally.
Keep an eye out for opportunities to position yourself based on the cycle. If a suitable signal appears, I’ll share it in the chatroom.
#CPI前瞻,12月利率走向迎关键考验
Let’s review Ethereum’s daily moving averages and compare the timing of the first and second waves in previous bull markets, then share a few observations that may help you let go of your bull-market fixation.
First, the daily moving averages have formed a bearish alignment. Looking back at history, this structure has rarely appeared during the genuine upward phase of a bull market. It is a strong warning sign in itself.
Second, the timing doesn’t match a standard second wave. The first wave of this cycle took about a month to get underway, while the current correction has already lasted a month and a half. In past bull markets, the first wave typically lasted 2–3 times as long as the second wave, and corrections rarely lasted longer than the first wave. In terms of timing, this looks more like the main downward wave than a buildup before a rebound.
Third, the way the market sold off at key support levels doesn’t look right. The previous drops to 2155 and 2078 came after sideways trading over the weekend, followed by a rapid plunge, mostly liquidating highly leveraged positions. There wasn’t the kind of full-blown panic washout you’d expect. A convincing market bottom often requires thoroughly crushing bullish sentiment. Given the current price action, 2050 is unlikely to be the start of a major upward move.
Overall, a short-term rebound isn’t out of the question, but don’t set your expectations too high. First, watch 2204 on the upside. If momentum is strong, the upper limit is probably around 2330; it’s unlikely to open up room for a major rally.
Keep an eye out for opportunities to position yourself based on the cycle. If a suitable signal appears, I’ll share it in the chatroom.
#CPI前瞻,12月利率走向迎关键考验