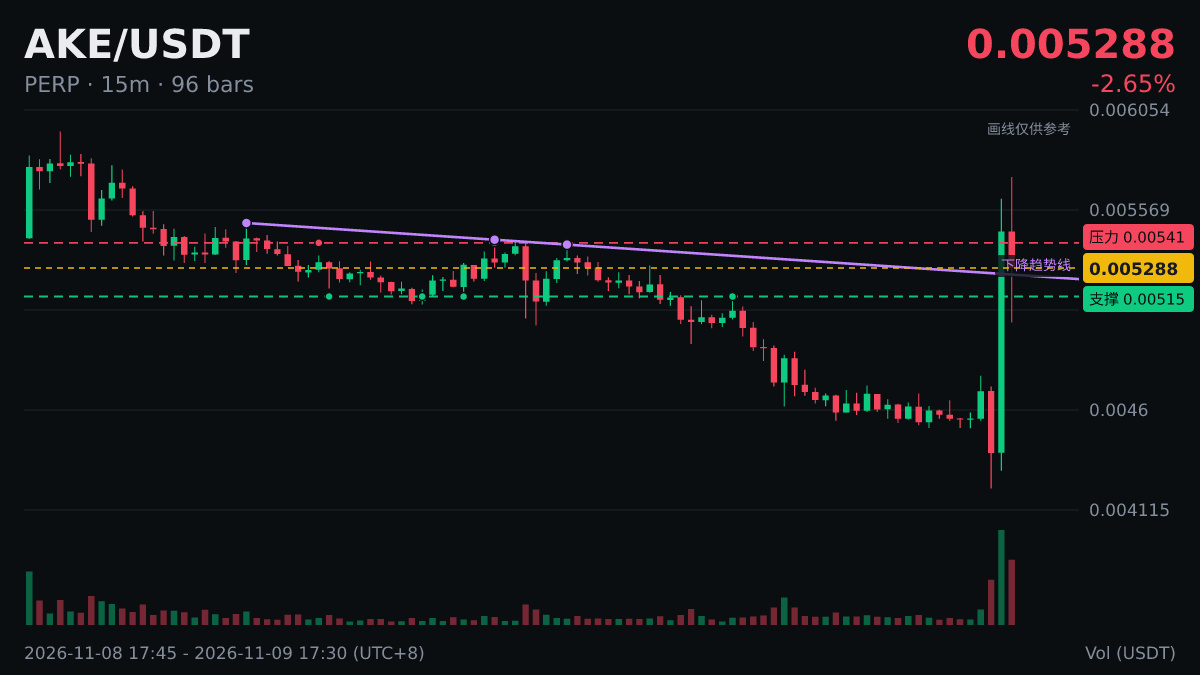
$AKE breaks above the 0.005 threshold.
Let's use this figure to unpack the idea of key price levels.
The longer it's been since the price last reached this level, the more the distribution of positions around it may have changed; the balance of bullish and bearish forces back then may no longer hold.
The first rebound after a breakdown is often seen as a test: if the price is pushed back down below the level, the idea that support has turned into resistance becomes more convincing.
Indicators can fail, but risk management shouldn't be skipped: thinking ahead about what to do if you're wrong matters more than getting the prediction right.
#AKE
Let's use this figure to unpack the idea of key price levels.
The longer it's been since the price last reached this level, the more the distribution of positions around it may have changed; the balance of bullish and bearish forces back then may no longer hold.
The first rebound after a breakdown is often seen as a test: if the price is pushed back down below the level, the idea that support has turned into resistance becomes more convincing.
Indicators can fail, but risk management shouldn't be skipped: thinking ahead about what to do if you're wrong matters more than getting the prediction right.
#AKE