$DODO: Decoding the Surge Above Resistance
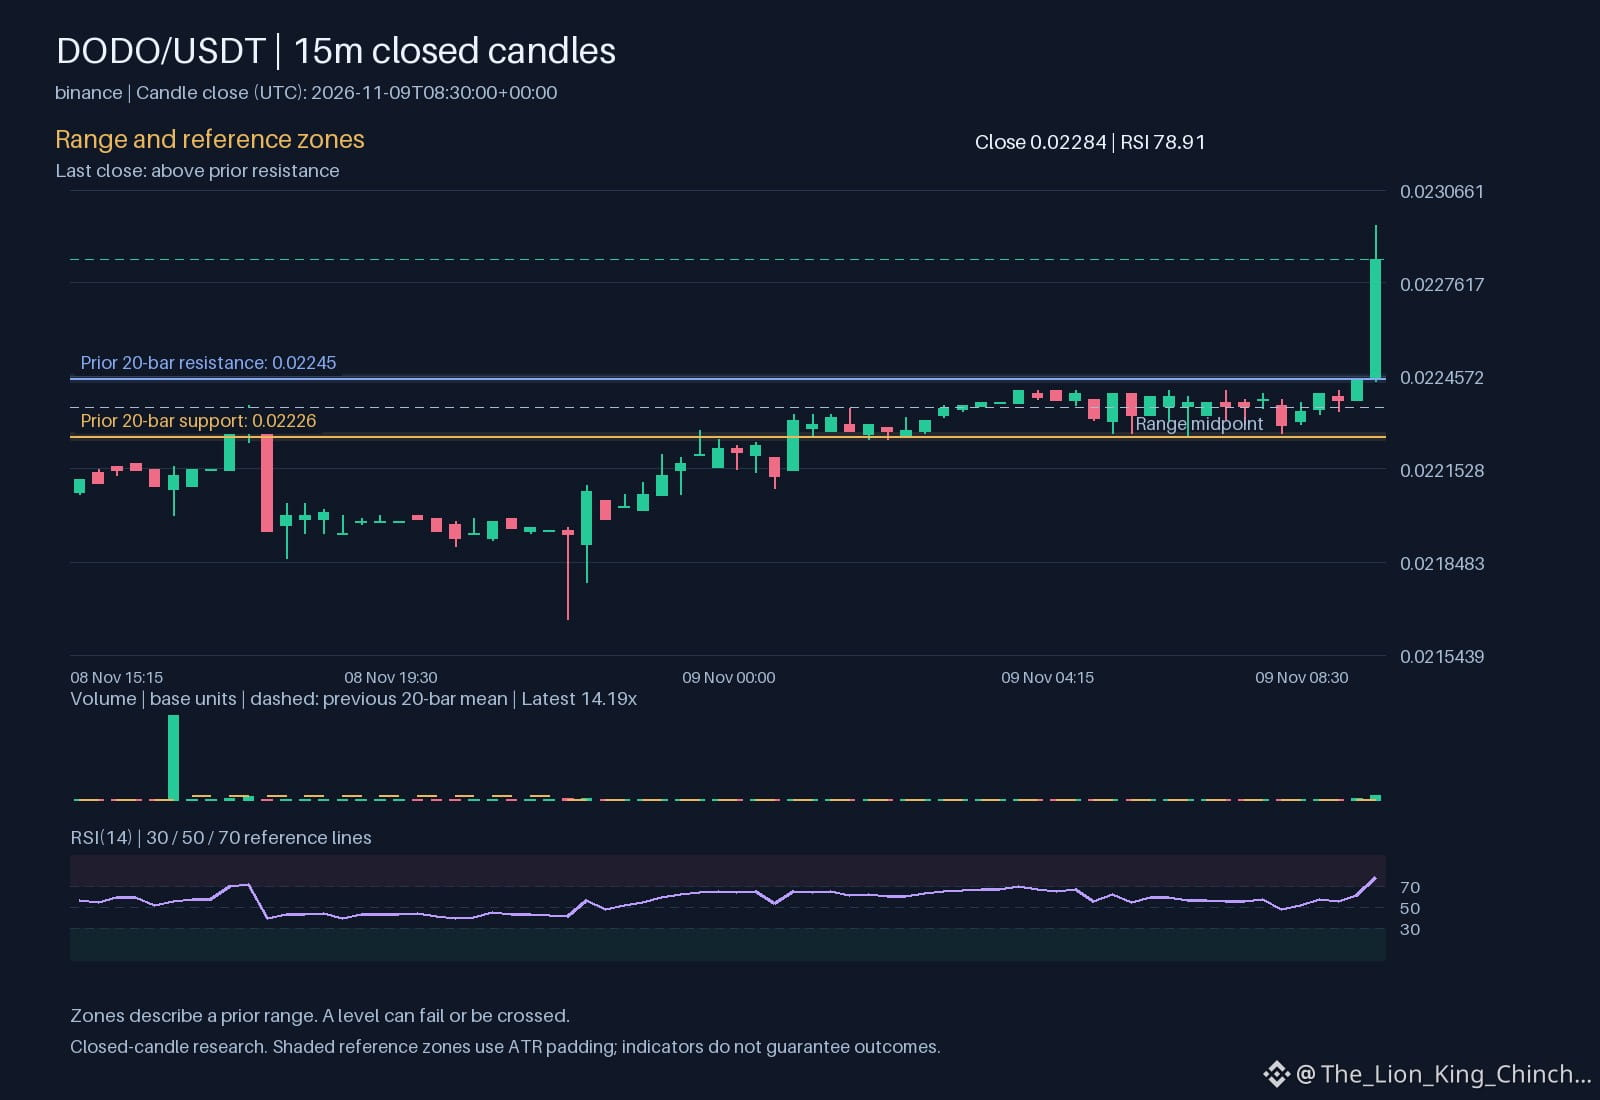
Does a price move above resistance always confirm a lasting shift in market structure? The current observation shows $DODO trading in an upward hourly direction while positioned above resistance. This move is supported by volume that sits above the baseline, creating a scenario where high activity meets a technical breakout.
The primary clue for a bullish reading is the combination of high volume and the breach of a key level. When more participants trade at higher prices, it suggests that the market is actively absorbing supply. This mechanism often reflects a temporary imbalance where demand outweighs available sell orders.
However, an alternative reading suggests this could be a liquidity grab. Sometimes, a move above resistance on high volume pulls in breakout buyers only for the price to reverse once the orders are filled. If the price fails to stay above 0.02245, the high volume might actually represent a climax of buying rather than the start of a trend.
A failure to sustain the daily close above 0.02245 would weaken the bullish interpretation. Furthermore, if the RSI reaches 78.908 while volume begins to fade, it might indicate that the move has exhausted itself. We can reassess this by watching if $DODO maintains its position above 0.0224047 or if it slips back into the previous range. A drop below 0.02226 would invalidate the breakout logic entirely.
Probabilistic market research, not a recommendation or guaranteed return.
Which observation would make you change your reading?
#DODO #MarketAnalysis
Does a price move above resistance always confirm a lasting shift in market structure? The current observation shows $DODO trading in an upward hourly direction while positioned above resistance. This move is supported by volume that sits above the baseline, creating a scenario where high activity meets a technical breakout.
The primary clue for a bullish reading is the combination of high volume and the breach of a key level. When more participants trade at higher prices, it suggests that the market is actively absorbing supply. This mechanism often reflects a temporary imbalance where demand outweighs available sell orders.
However, an alternative reading suggests this could be a liquidity grab. Sometimes, a move above resistance on high volume pulls in breakout buyers only for the price to reverse once the orders are filled. If the price fails to stay above 0.02245, the high volume might actually represent a climax of buying rather than the start of a trend.
A failure to sustain the daily close above 0.02245 would weaken the bullish interpretation. Furthermore, if the RSI reaches 78.908 while volume begins to fade, it might indicate that the move has exhausted itself. We can reassess this by watching if $DODO maintains its position above 0.0224047 or if it slips back into the previous range. A drop below 0.02226 would invalidate the breakout logic entirely.
Probabilistic market research, not a recommendation or guaranteed return.
Which observation would make you change your reading?
#DODO #MarketAnalysis