#BTC / USDT: ANALYSIS
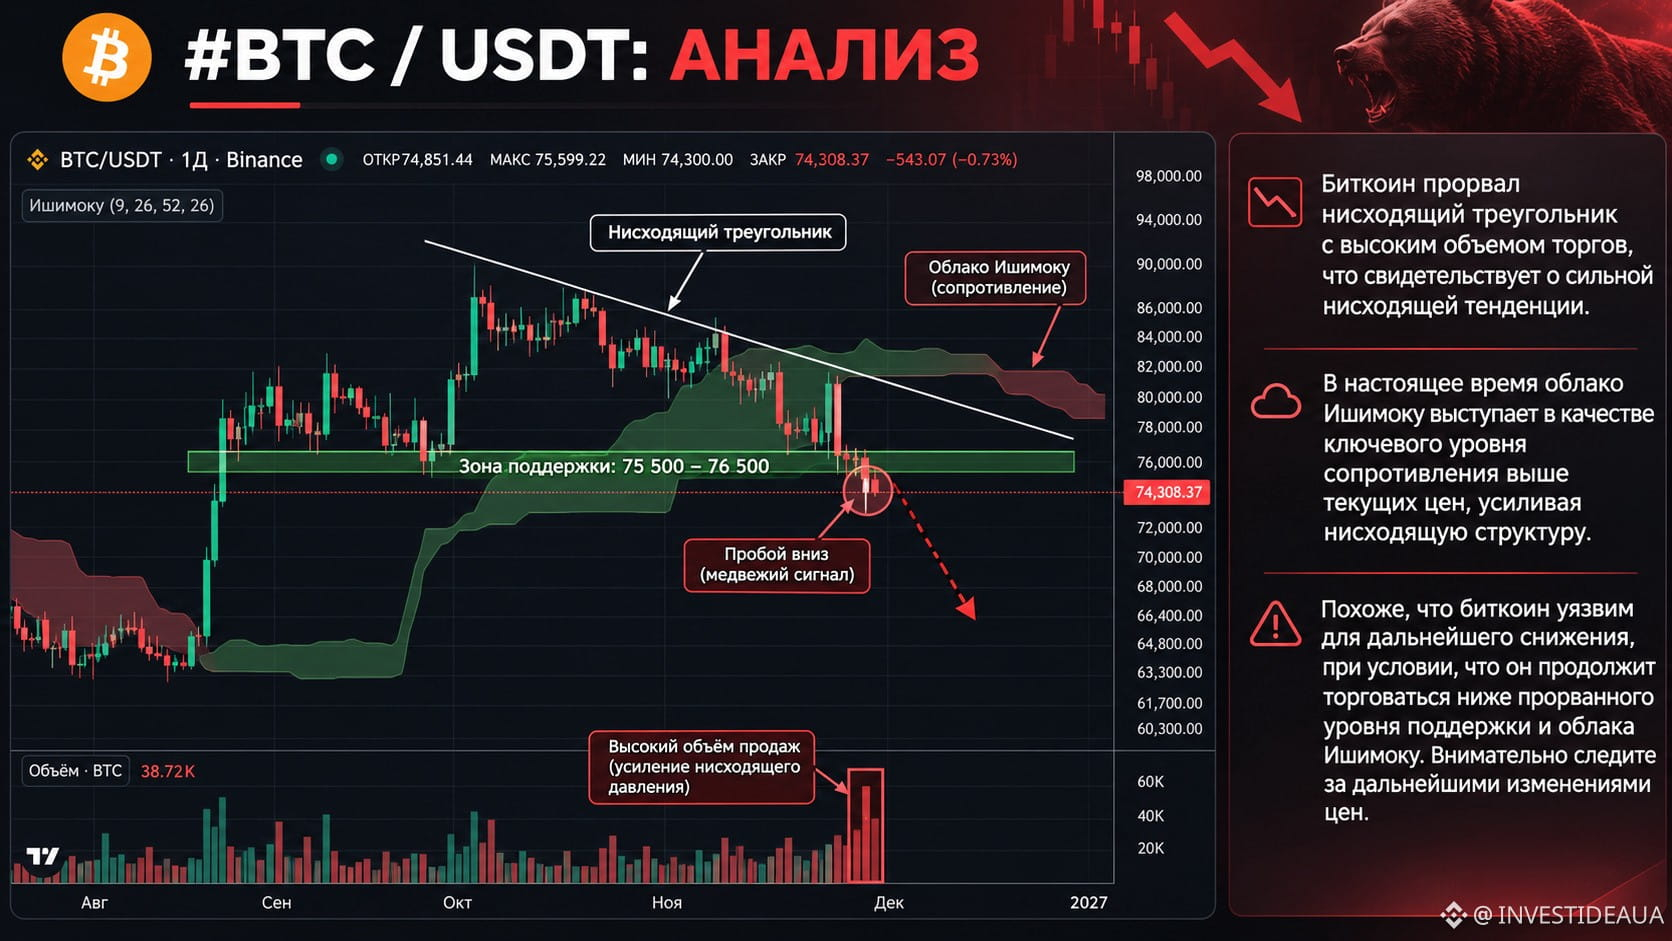
Bitcoin broke below a descending triangle on high trading volume, signaling a strong downward trend.
The Ichimoku cloud is currently acting as a key resistance level above the current price, reinforcing the bearish structure.
Bitcoin appears vulnerable to further declines, provided it continues to trade below the broken support level and the Ichimoku cloud. Watch price movements closely for further developments. Generate a realistic image for me based on this Bitcoin chart, with the description and analysis I gave you. The image should be horizontal, not vertical.
Bitcoin broke below a descending triangle on high trading volume, signaling a strong downward trend.
The Ichimoku cloud is currently acting as a key resistance level above the current price, reinforcing the bearish structure.
Bitcoin appears vulnerable to further declines, provided it continues to trade below the broken support level and the Ichimoku cloud. Watch price movements closely for further developments. Generate a realistic image for me based on this Bitcoin chart, with the description and analysis I gave you. The image should be horizontal, not vertical.