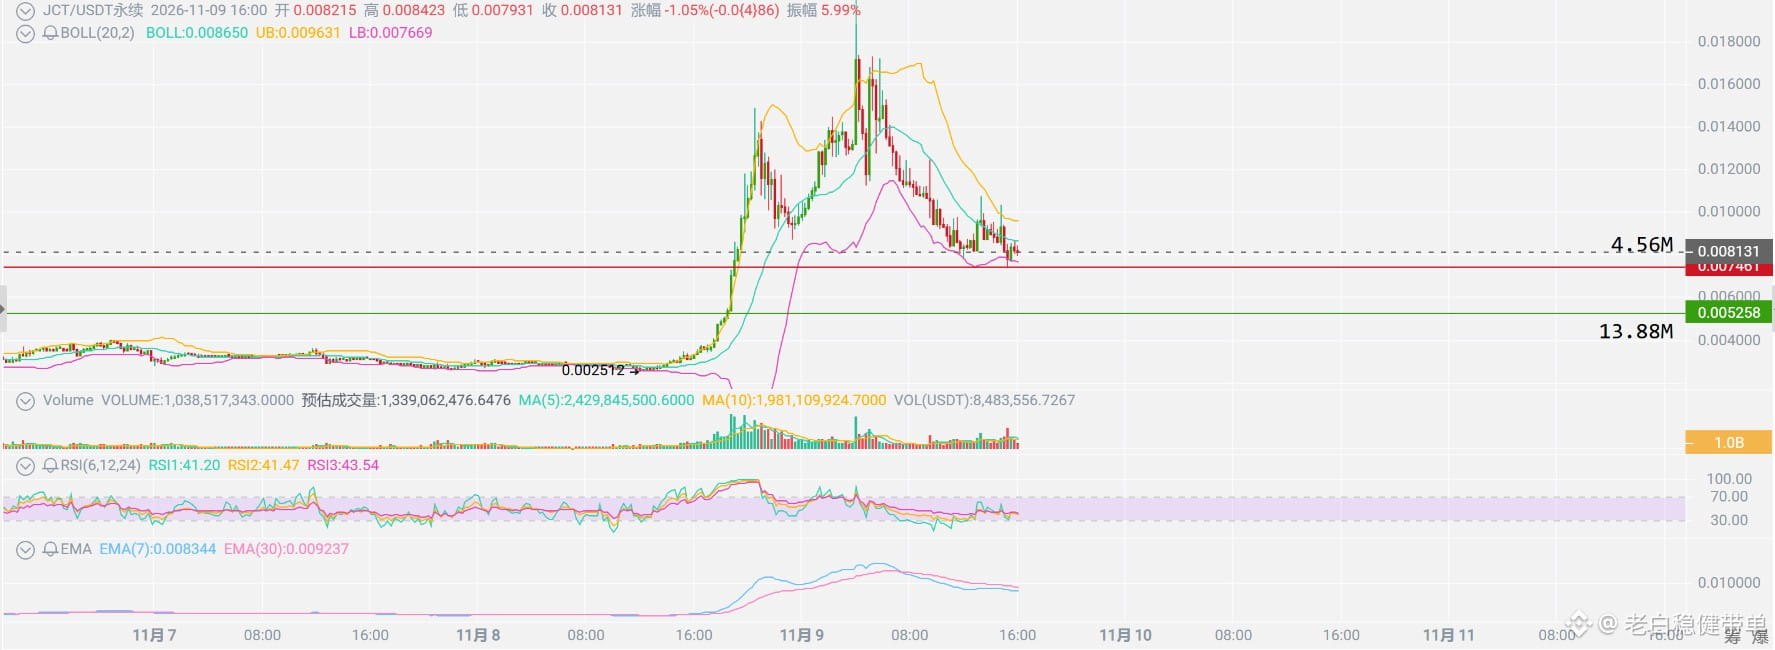
$JCT Key levels: breaking down the major players’ cost lines
The red line on the chart is the cost basis of the major short positions. It is currently below the market price. If the price falls back to around 0.00746, many short positions will close at breakeven. Closing shorts means buying, which can create buying support.
The nearest short-term support buffer is at 0.00767. The key support level is around 0.00526, where the major long positions’ cost basis lies. The first major resistance above is at 0.0096.
The trading idea is to watch for a pullback to around 0.00746 and consider a small position to trade a rebound driven by short covering. If the price breaks below this level on strong volume, it means the bears have no intention of closing their positions and may keep pushing the price down.
After a huge rally, a coin’s support can be more fragile than expected. Want to see when this support level gets tested? Join the chat room.
#比特币连续五周下跌
The red line on the chart is the cost basis of the major short positions. It is currently below the market price. If the price falls back to around 0.00746, many short positions will close at breakeven. Closing shorts means buying, which can create buying support.
The nearest short-term support buffer is at 0.00767. The key support level is around 0.00526, where the major long positions’ cost basis lies. The first major resistance above is at 0.0096.
The trading idea is to watch for a pullback to around 0.00746 and consider a small position to trade a rebound driven by short covering. If the price breaks below this level on strong volume, it means the bears have no intention of closing their positions and may keep pushing the price down.
After a huge rally, a coin’s support can be more fragile than expected. Want to see when this support level gets tested? Join the chat room.
#比特币连续五周下跌